¶ Introduction
As organizations grow, the volume of data they handle each year increases exponentially. The number of users who require access to this data in the form of reports also grows, and the complexity of these reports is rising due to demand from management at all levels for up-to-the-minute information to make crucial business decisions.
It is not surprising that reporting requires more time and resources, resulting in additional costs for businesses.
Organizations that opt for a custom-developed system have the opportunity to ensure they have access to critical reports that enable them to manage their business more effectively. However, the reporting aspect is often not given enough consideration until after the system has been built, despite being mentioned at the start of the project. As a result, the necessary data to generate these reports is often not captured, and additional work is required to integrate the reporting system.
This wiki page will provide information on Workspaces, Inquiries, and Reports.
- Workspaces are interactive dashboards that provide a customizable, role-based user interface for accessing and analyzing data. They display a collection of related information and tasks, such as data lists, charts, and reports.
- Inquiries allow users to retrieve and view specific data in a table format. They are often used to perform ad hoc queries, analyze data trends, and identify patterns. Inquiries can also be customized to show specific data fields and filter information based on certain criteria.
- Reports provide a more structured and formal way of presenting data. Reports can be created using Microsoft Power BI or other third-party reporting tools and can be customized to meet specific business needs. Reports can be run on-demand or scheduled to run automatically on a regular basis. They can also be distributed in a variety of formats, including PDF, Excel, or HTML.
¶ Navigation
¶ Workspaces
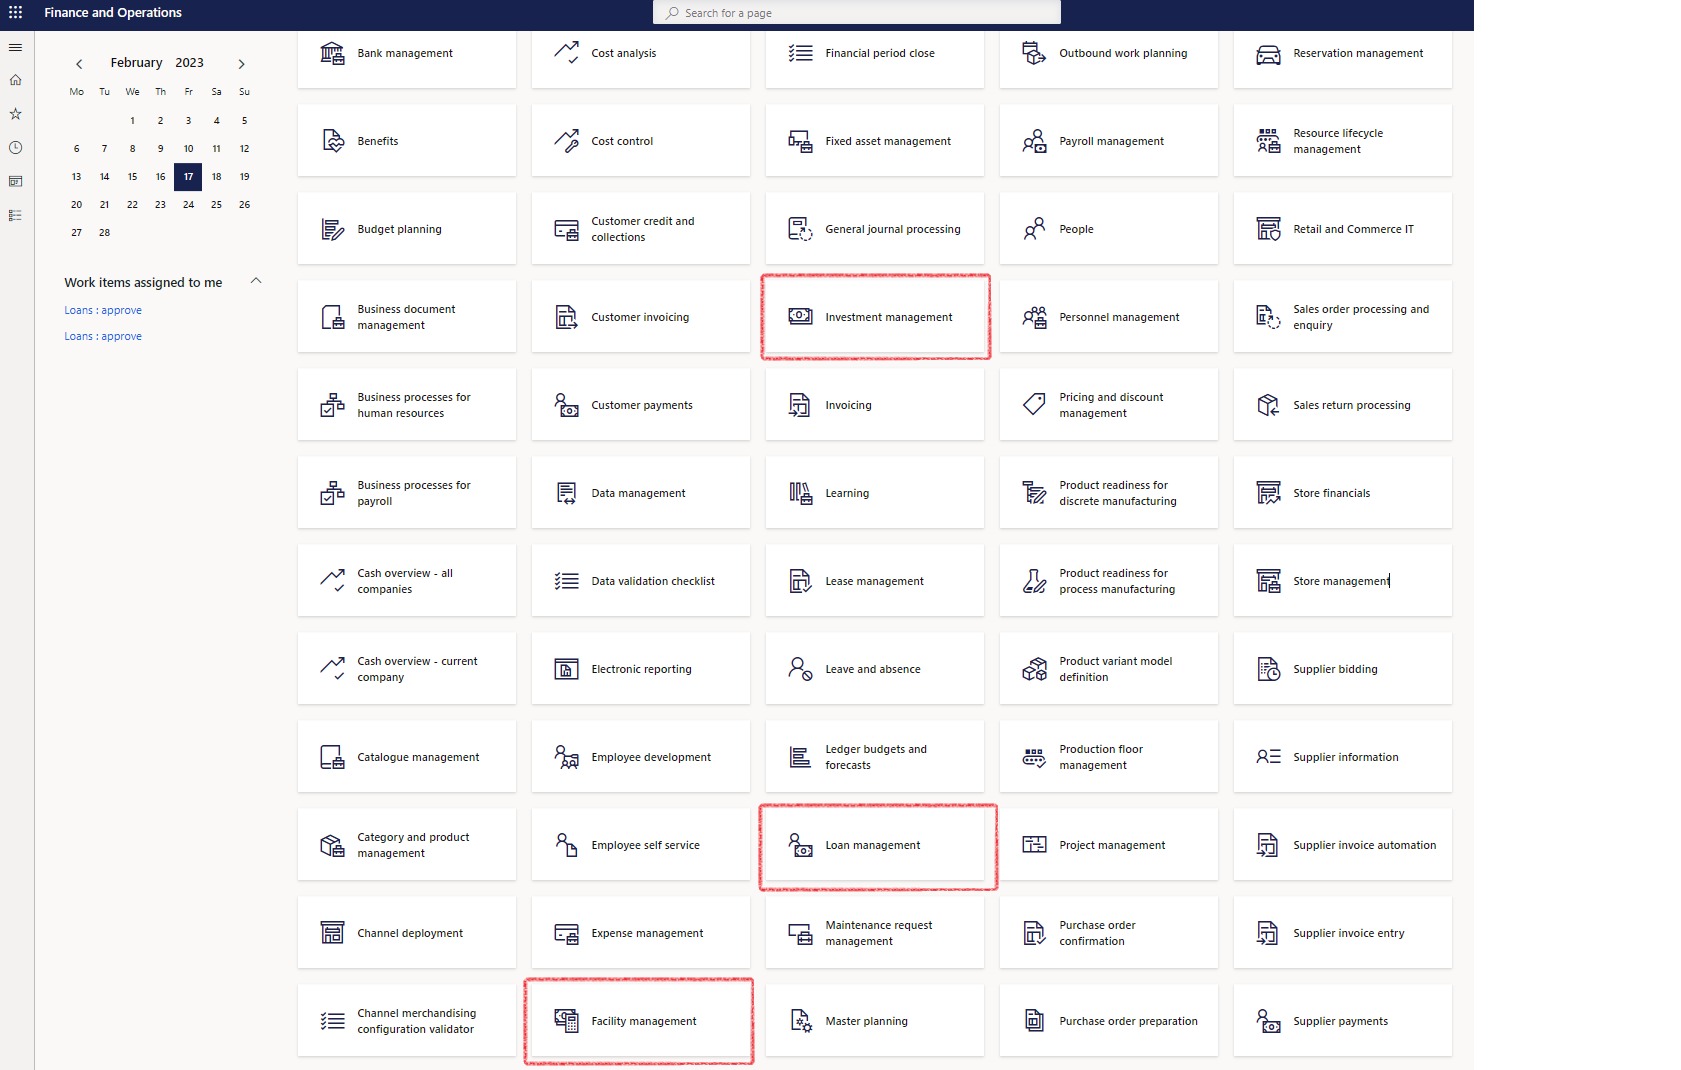
Workspaces in Microsoft Dynamics 365 Finance and Operations are designed and optimized for common roles within an organization. They serve as the primary access point for the application, where users can complete various tasks, monitor specific reports and KPIs, and manage their day-to-day responsibilities. Workspaces can be tailored to the needs of different departments or job functions, making it easier for users to find the information they need and complete their tasks quickly.
This article will guide you through everything you need to know to fully leverage this highly productive feature.
¶ Investment management workspace
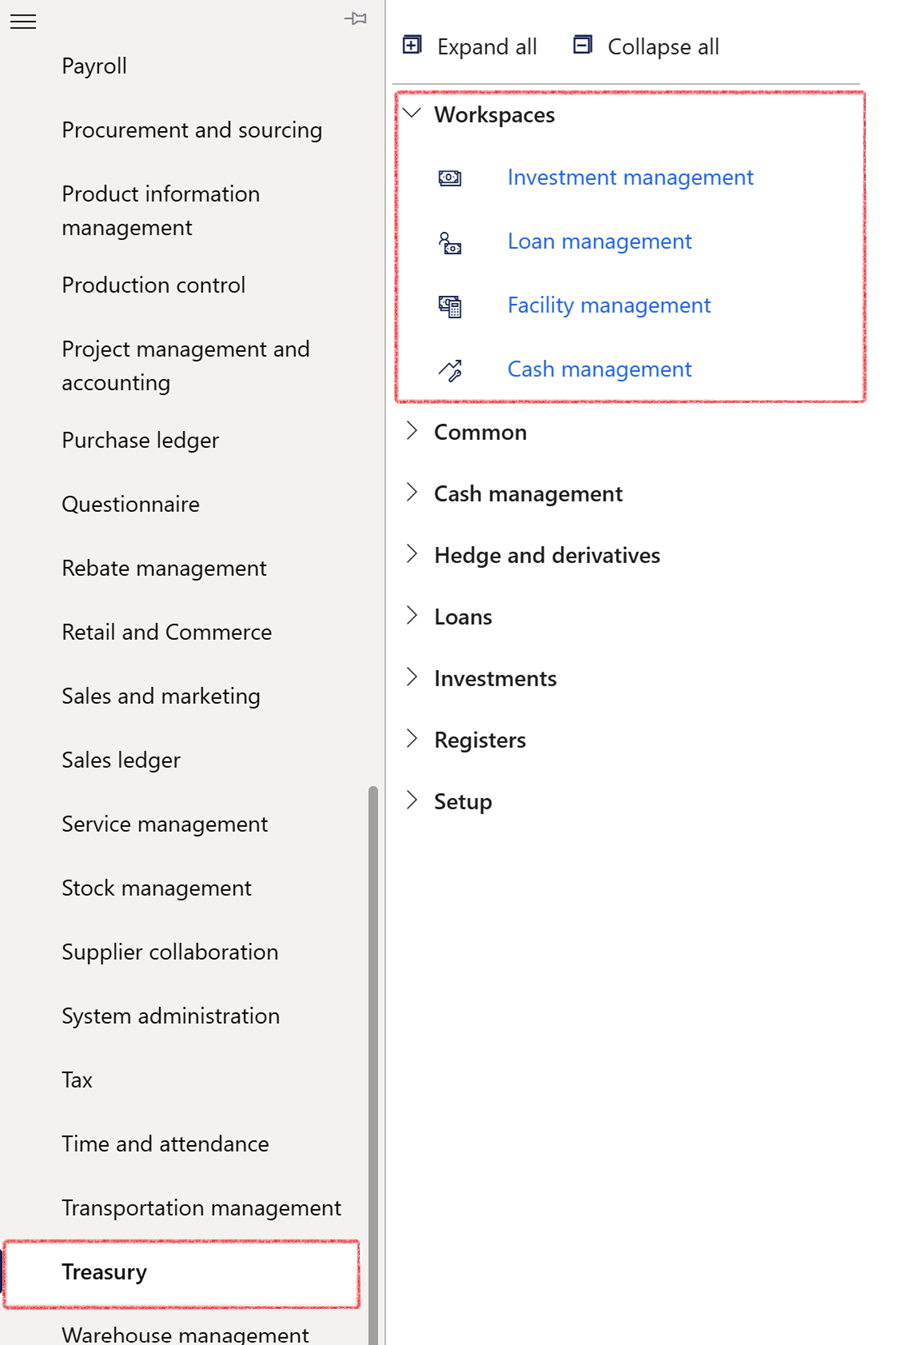
Go to: Treasury > Workspaces > Investment management
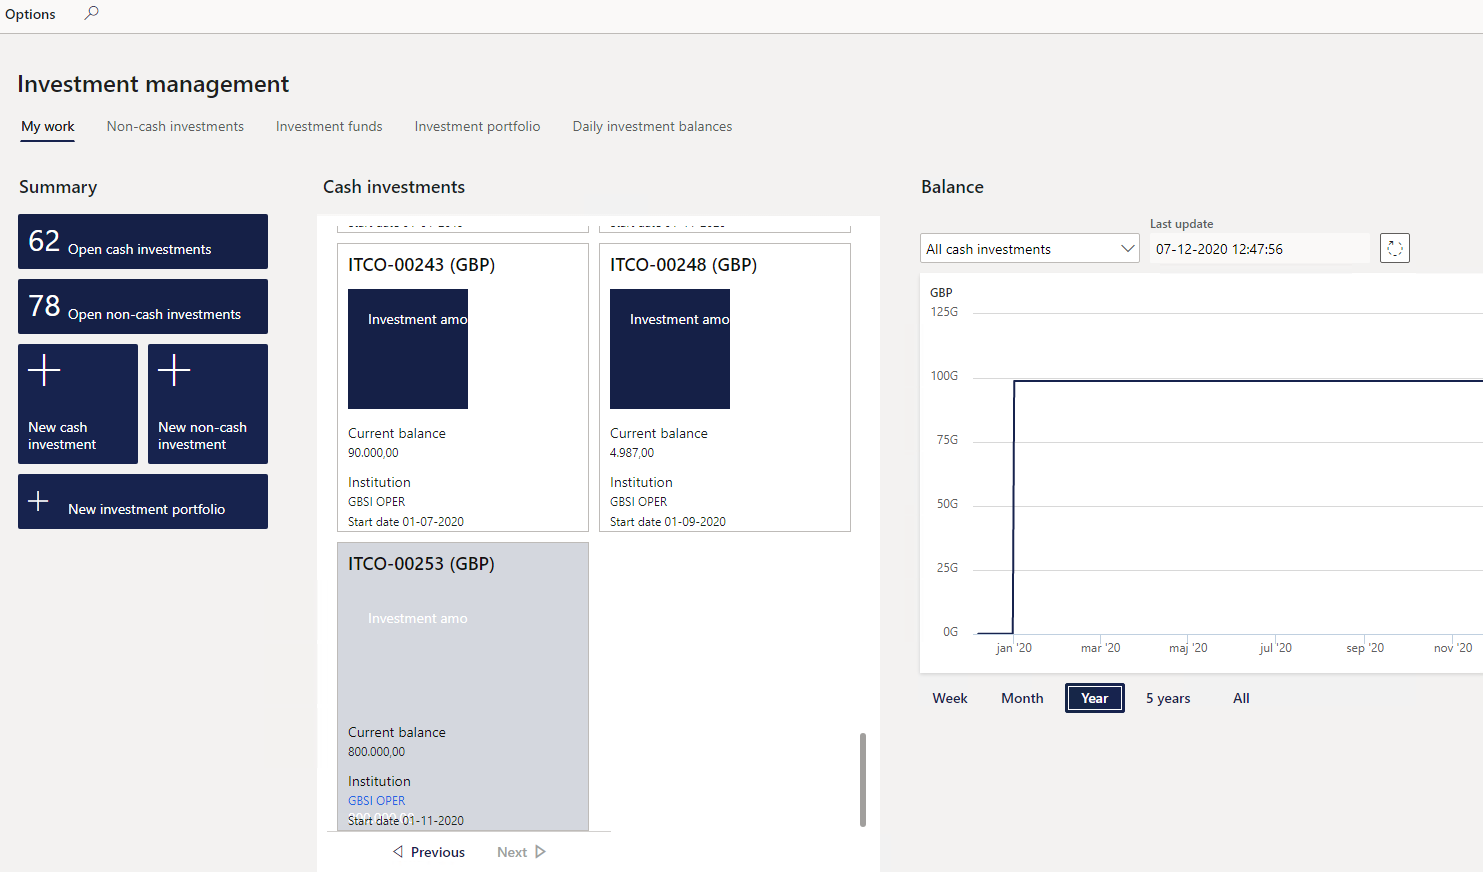
The following tabs can be used:
- My work
- Non-cash investments
- Investment funds
- Investment portfolio and
- Daily investment balances
¶ My work tab will display the following summary:
- tiles on the left for Open cash investments, Open non-cash investments, Create New Cash investment, New Non-cash investment and New investment portfolio.
- in the centre all cash investments will display in blocks with more detail inside.
- The balance for the specific cash investment, or all investments will display in a graph for Week, Month, Year, 5 years or all
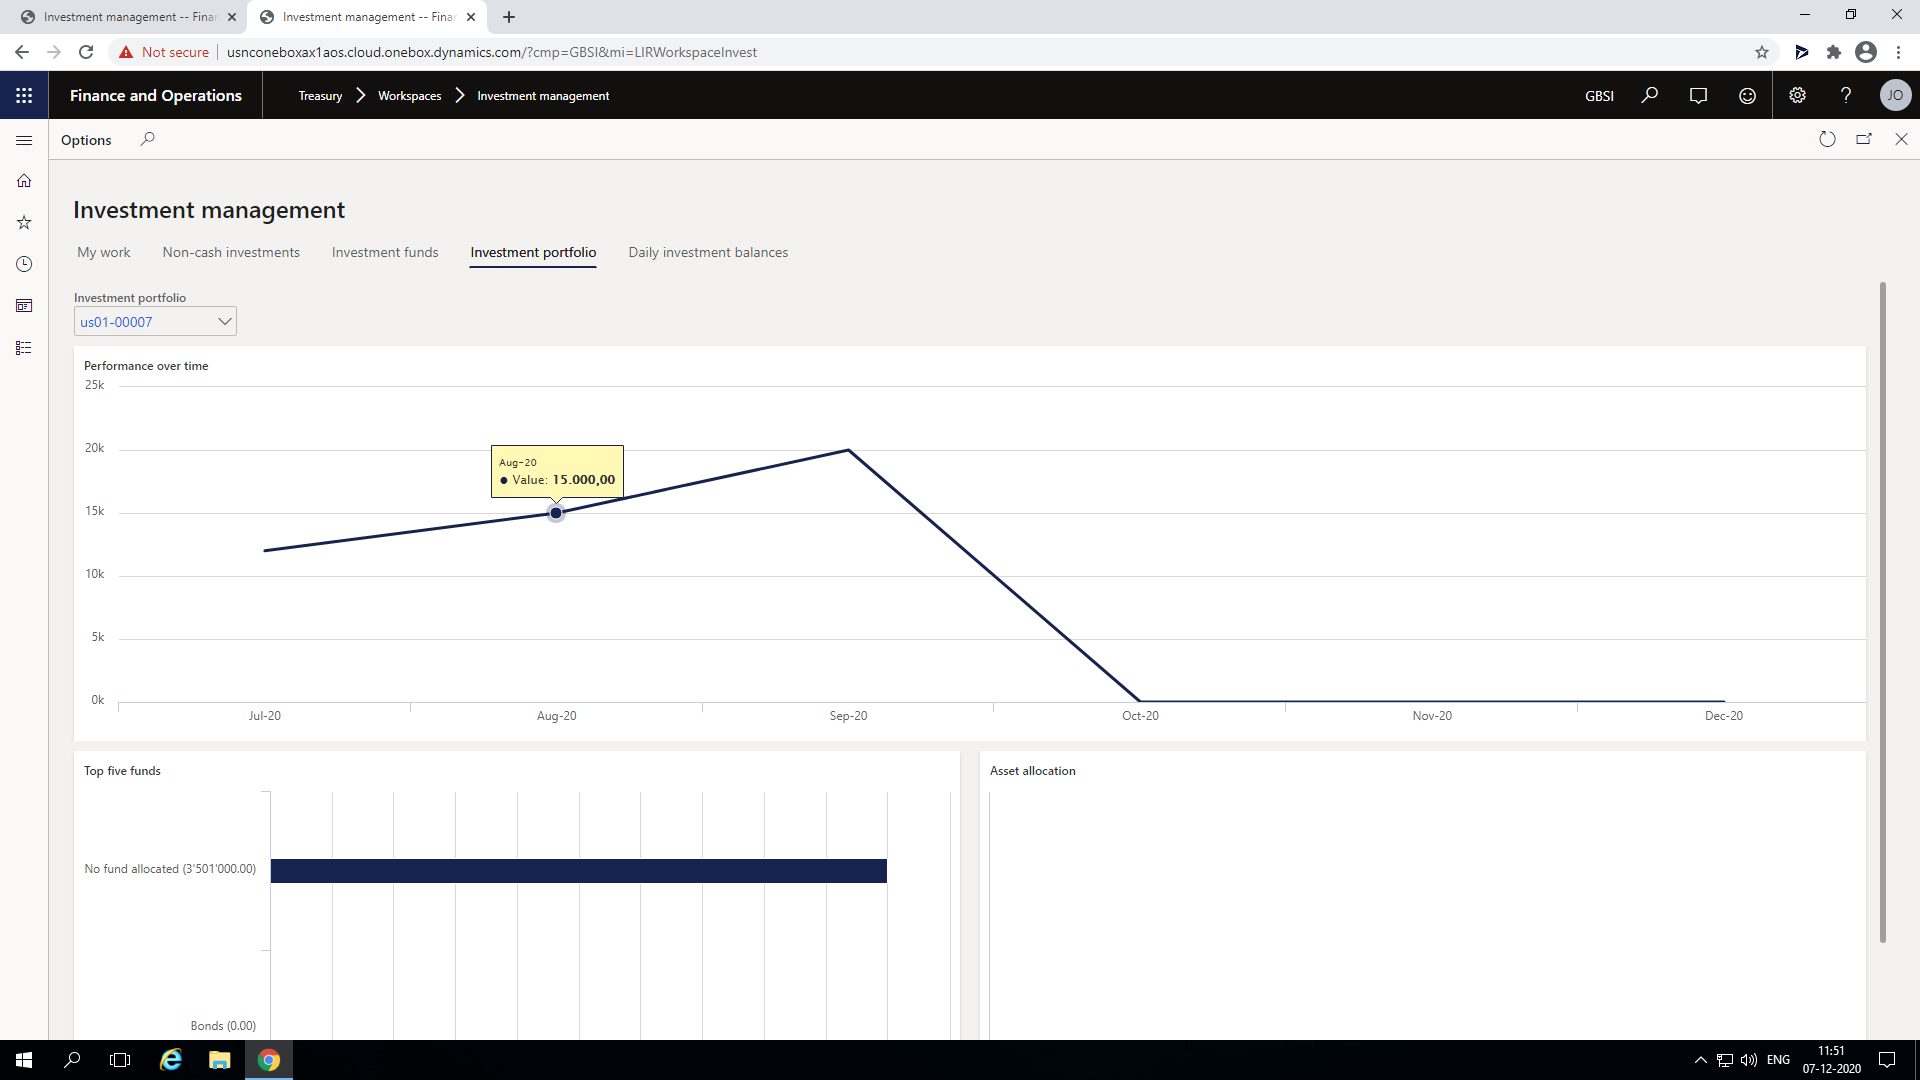
¶ Investment Profile
- A graph for a selected Investment will display
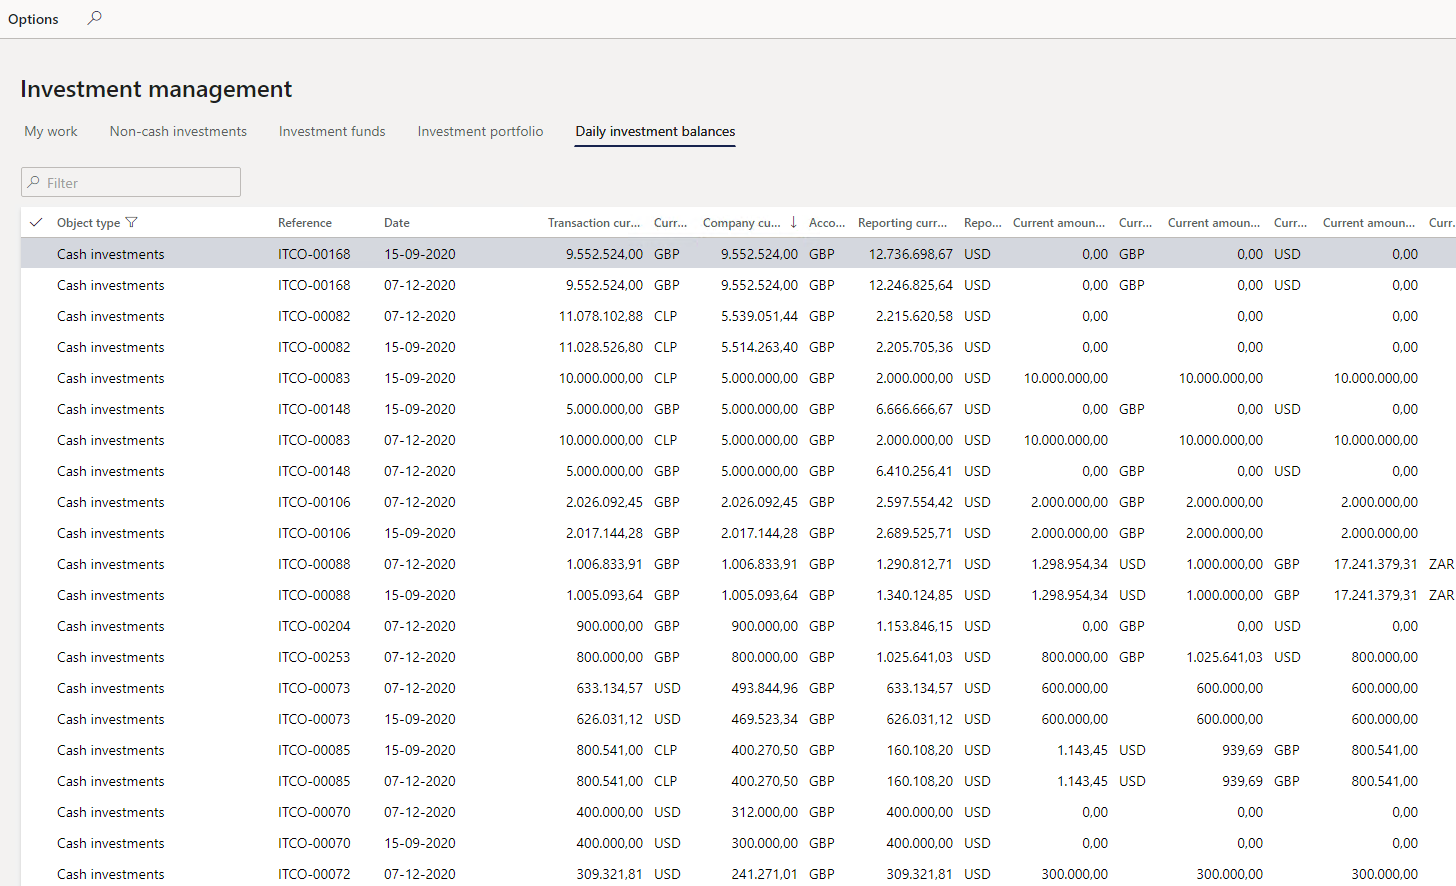
¶ Daily investment balances
- Daily investment balances will display a list page of all the daily balances for Cash investments
¶ Loan management workspace
- Go to Treasury>Workspaces>Loan management
- There are five areas in the loan workspace:
- My work
- Loan profile
- Loan analysis
- Loans per group
- Daily loan balances
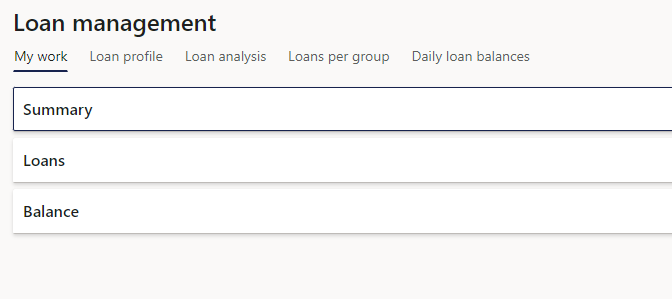
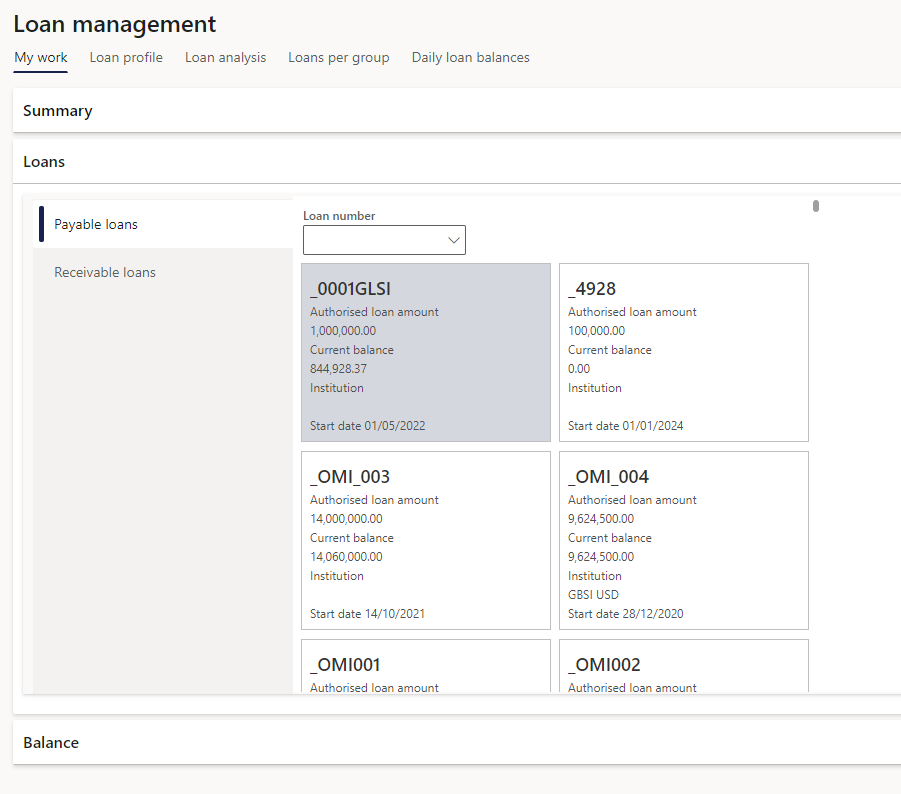
¶ My work tab
¶ Summary FastTab
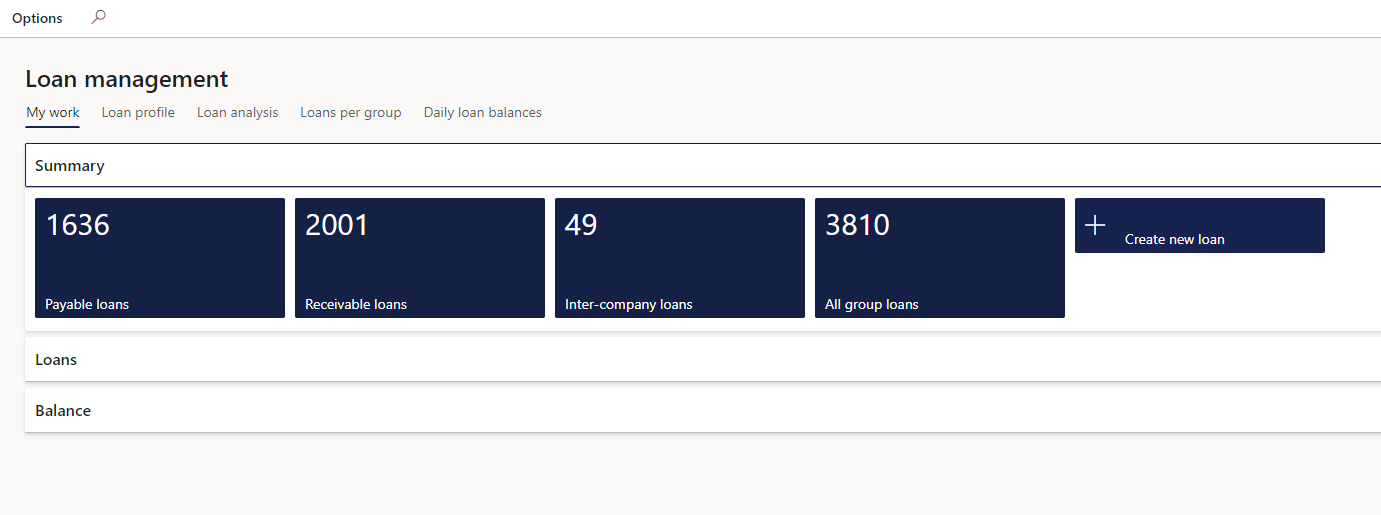
- The Summary FastTab contains tiles of loans and users can filter on a specific Payable or Receivable loans, or Inter-company loans.
- All group loans can also be viewed.
- All of this has a drill down functionality which will direct the user to those loans. Alternatively a new loan can be created from here.
¶ Loans FastTab
- Payable and Receivable loans can be viewed in alphabetical order. Users can filter on one specific loan.
- The transaction type for these loans will be Actual
¶ Balance FastTab
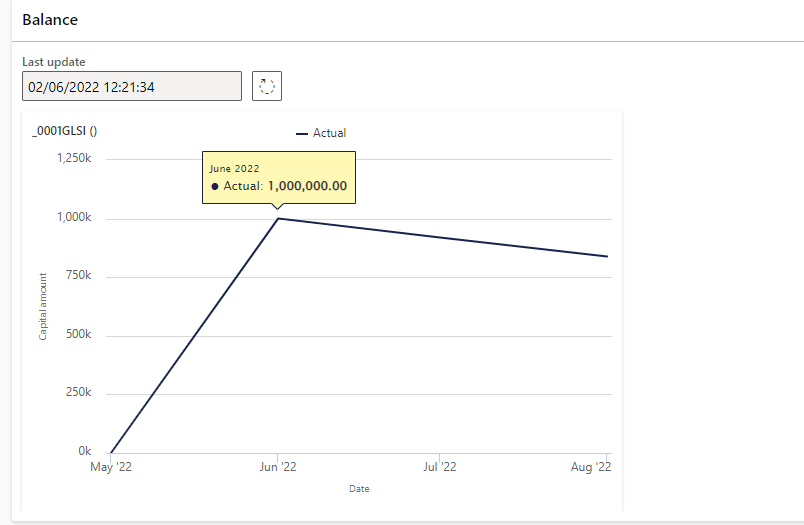
- The third FastTab on “My work” tab is called Balance. A graph will be displayed
¶ Loan profile tab
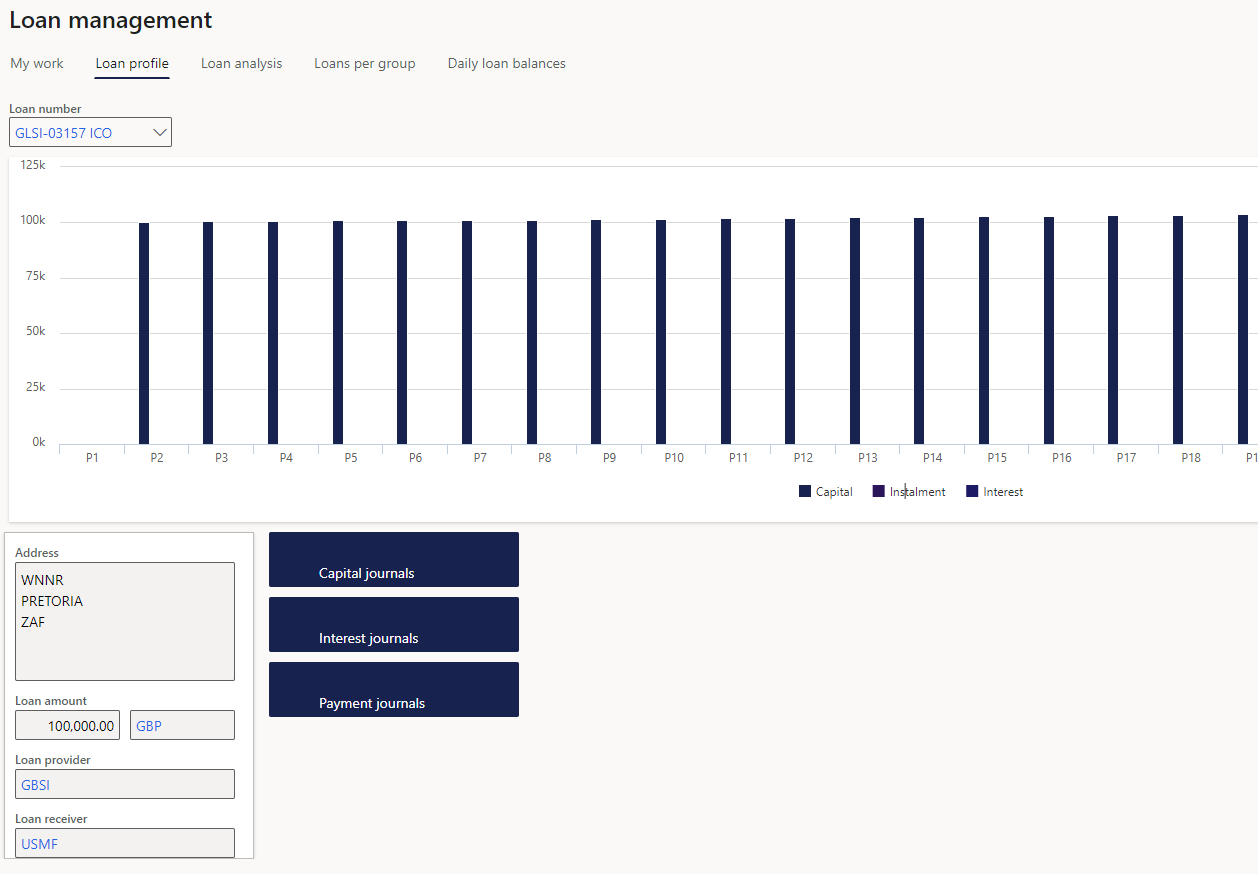
- This workspace page contains information about the loan provider or receiver, as well as a visualization of the Interest, Payment and Capital amounts for a specific loan selected.
¶ The Loans analysis tab
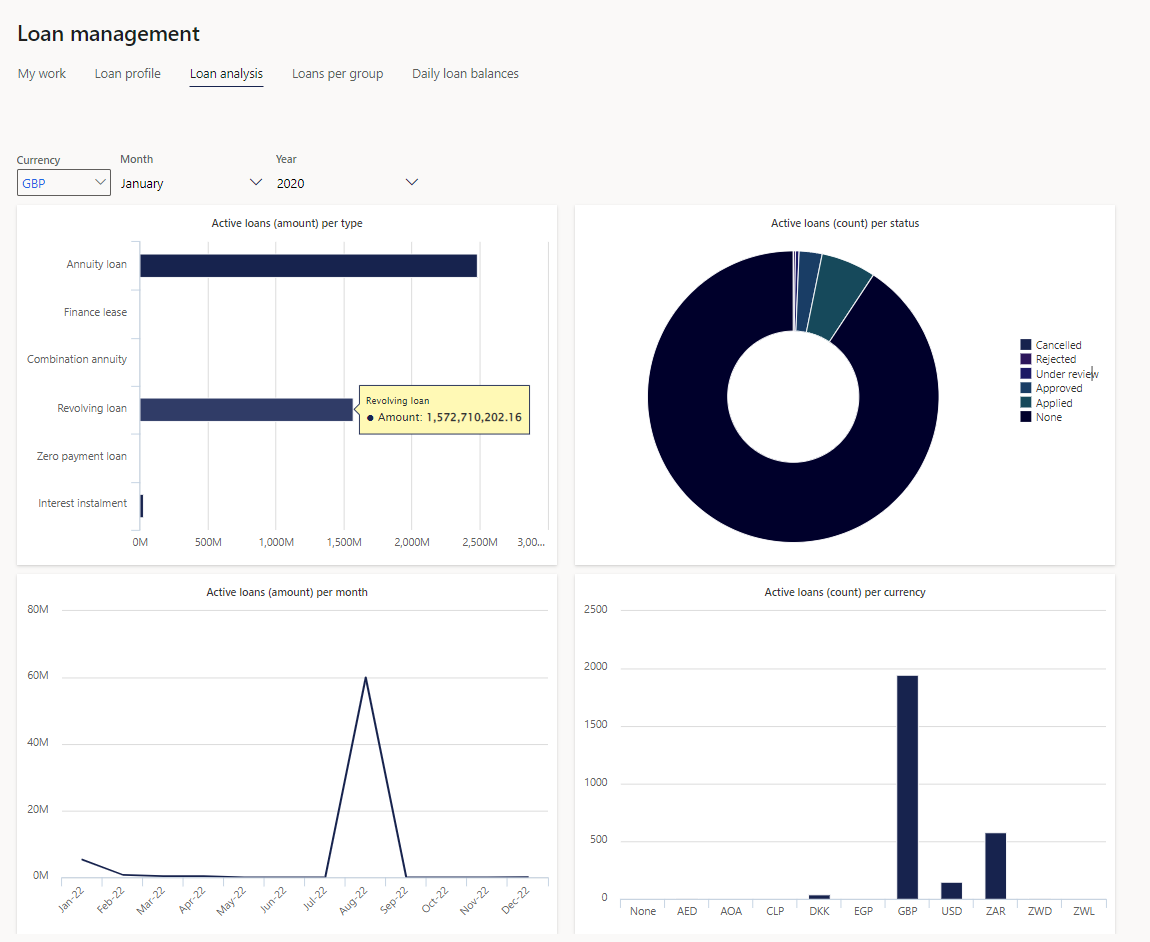
The Loans analysis tab display the following graphs:
- Active loans (count) per status
- a count of all loans summarised, per loan status
- Active loans (amount) per type
- Loans per currency, per loan amount and per loan type
- Active loans (count) per currency
- a loan count per currency
- Active loans (amount) per month
- the current amount, per month, and for a specific currency
¶ Loans per group tab
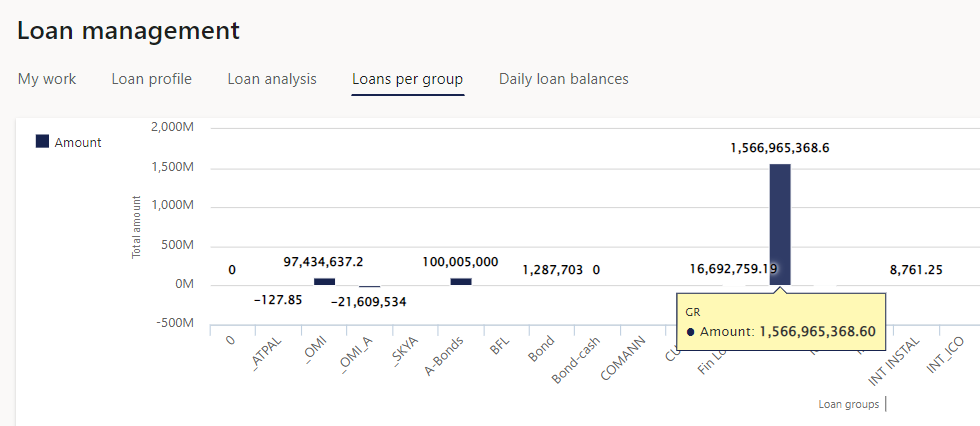
- Contains a chart of all the loan types and amounts of loans for each type of loan
¶ Daily loan balances tab
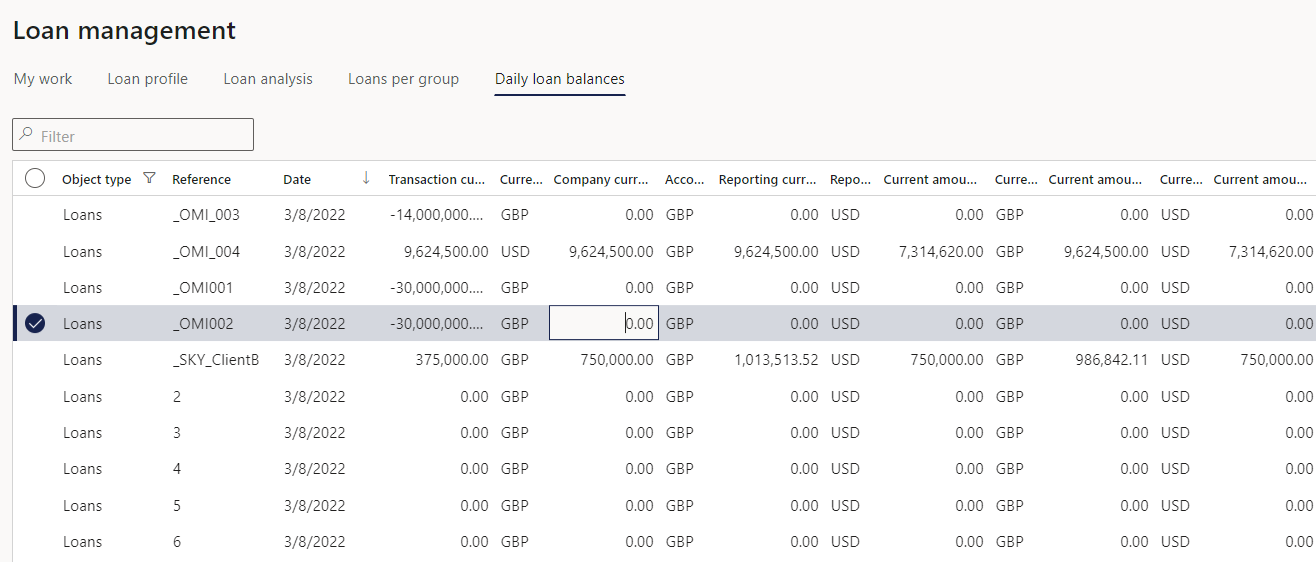
- View results of a periodic job for daily balances after it has been run. It recalculates the balances as at today’s date.
¶ Facility management workspace
The facility management workspaces can be accessed by navigating to:
The workspace consists of the following areas:
- My work
- Dashboard
- Pledged position
- Bank utilization
- Cost of borrowing
¶ My work tab
¶ Summary FastTab
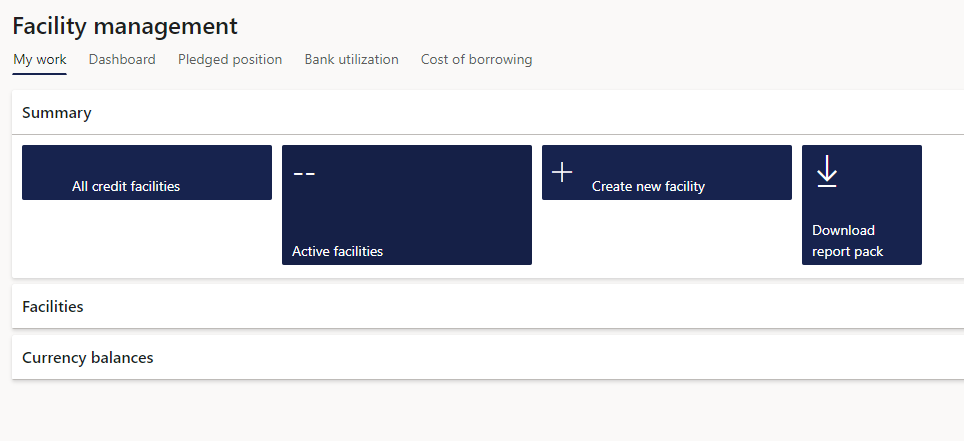
- Contains a summary FastTab, which displays the count of Credit facilities. The user can also create a new facility from this section.
¶ Facilities FastTab
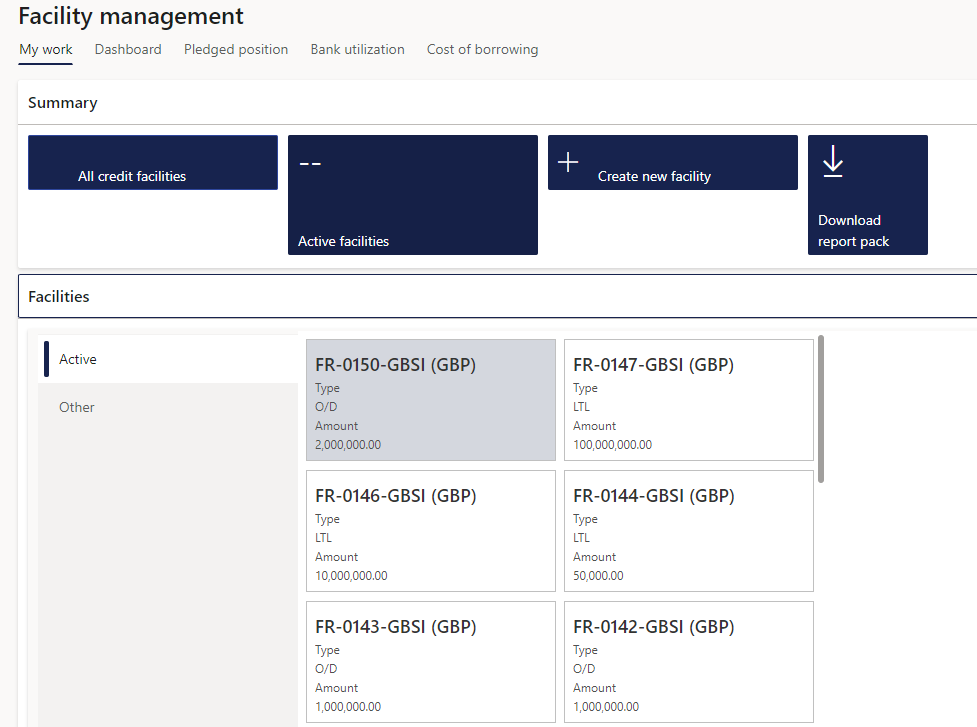
- The second FastTab is called Facilities. This contains tiles of Active and Other facilities, sorted by number. Active facilities will have a Start date and Valid until date.
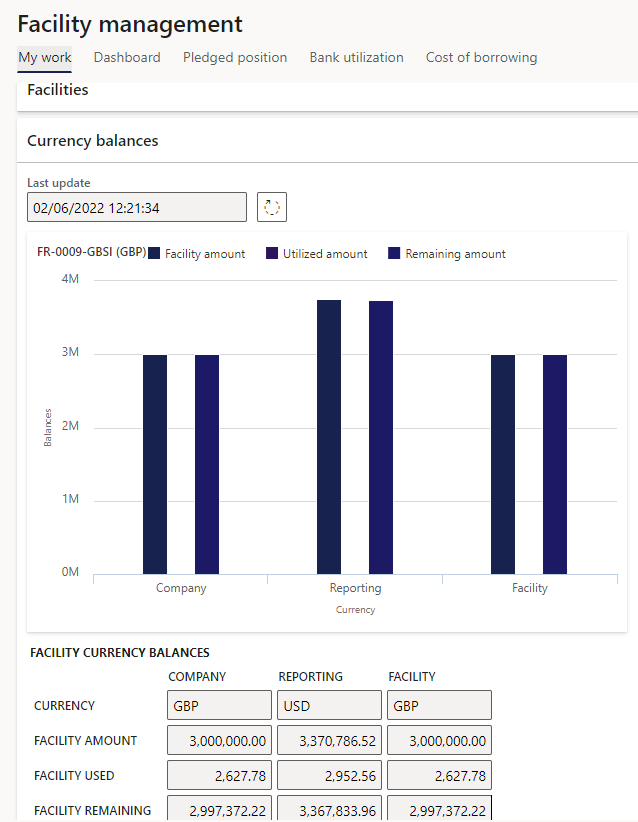
¶ Currency balances FastTab
- The third FastTab displays graph for the Currency balances for the facility that is selected on the tile in the middle of the workspace. The graph shows the Facility amount, Utilized amount and Remaining amounts
¶ Dashboard tab
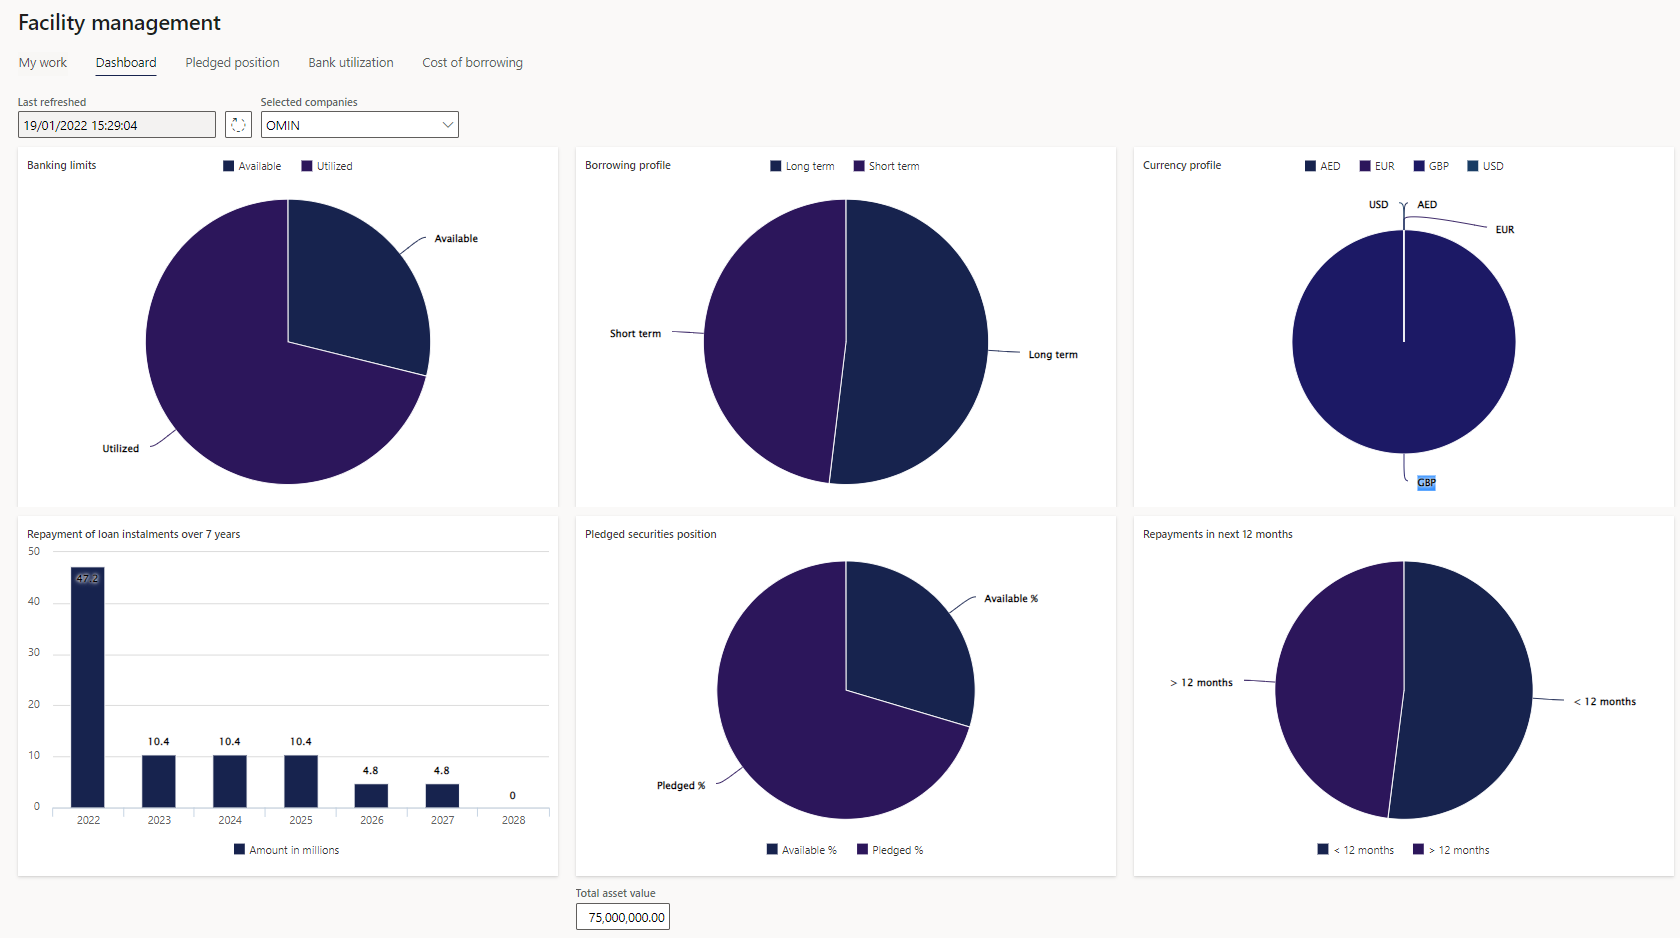
Dashboard of the following:
- Banking limits:
- total of utilized facilities
- total of available (not used) facilities
- displayed as a percentage of total facilities
- Borrowing profile
- total of short-term facilities utilized
- total of long-term facilities utilised
- both displayed as a percentage of total facilities utilized
- Currency profile
- total of facilities utilized, per currency
- expressed as a percentage of total facilities
- adjusted for currency exchange rates
- Repayment of loan instalments over 7 years
- Amounts expressed in millions
- Source is Redemption amounts as per projected loan statements
- X-axis is years
- Y-axis is Total of repayment amounts in company currency
- Pledged securities position
- amount of assets pledged against total assets
- pledged percentage is Total of market value of all securities pledged against facilities, as a percentage of total assets
- available percentage is Total of assets less total of market value of pledged securities, as a percentage of total assets
- Repayments in next 12 months
- Based on loans, but filter out inter-company loans (only bank loans)
- Repayment totals for 12 months
- As a percentage of total payments, on all loans
- Total asset value
¶ Pledged position tab
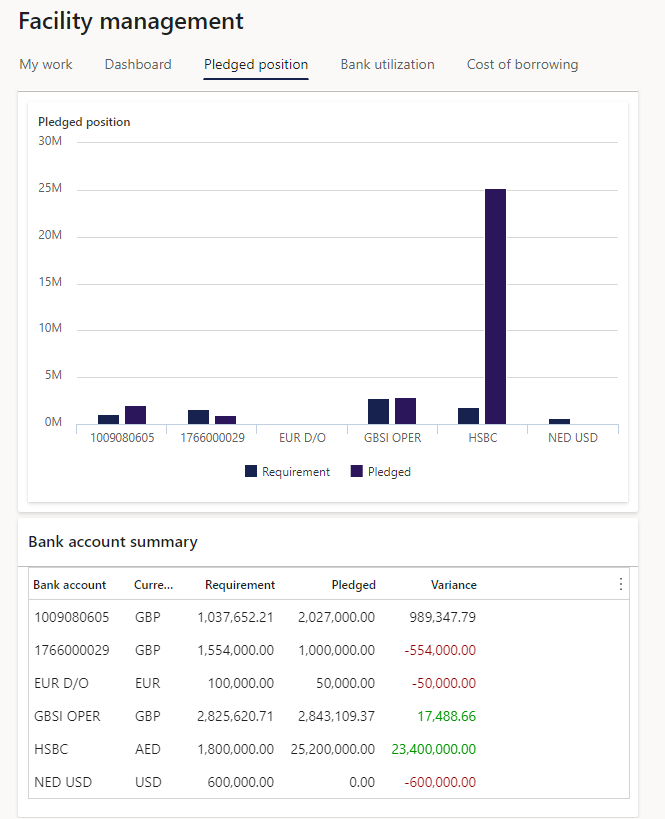
- Pledged position graph
- Bank account summary
- Bank account summary
- Bank account
- Currency
- Requirement
- Pledged amount
- Variance
¶ Bank utilization tab
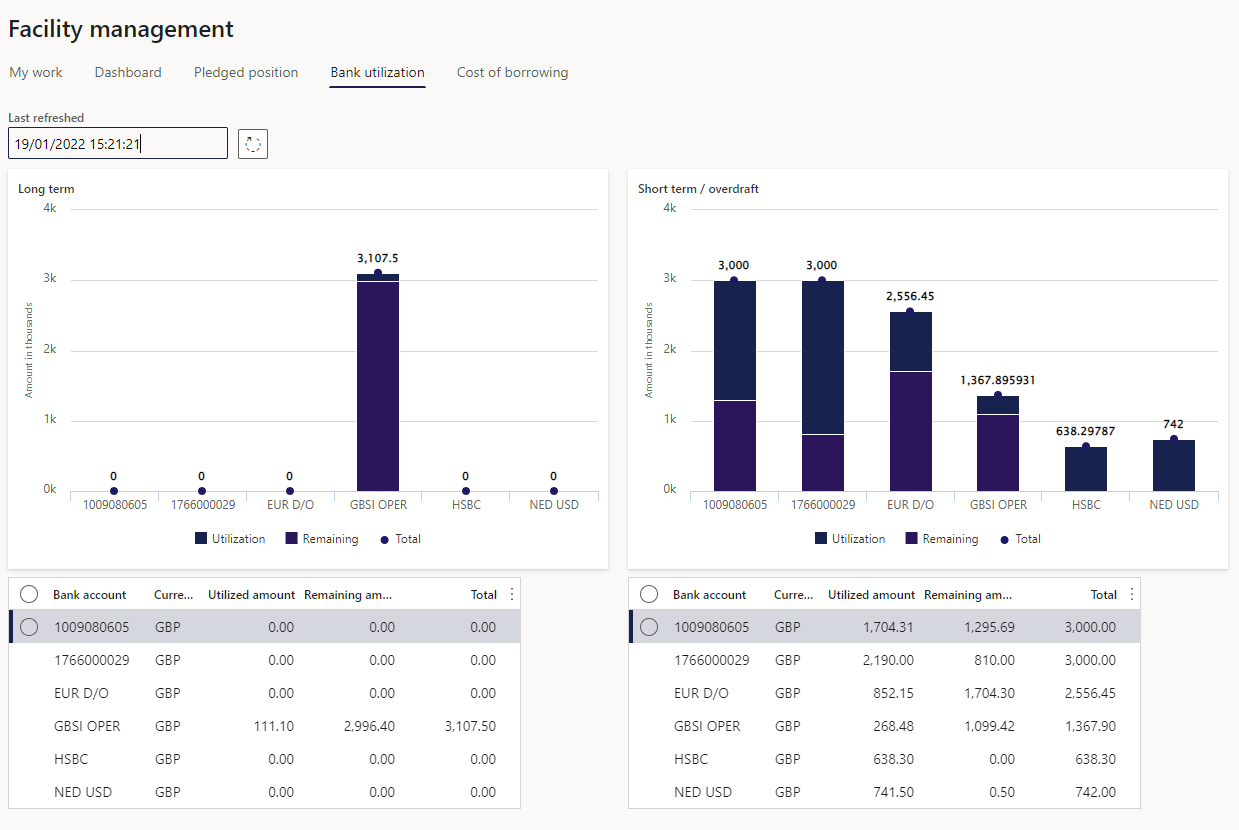
- Long term graph:
- Display balances linked to long term facilities
- Amounts rounded to thousands
- Totals per bank
- Per bank, broken into facilities available / utilised
- Total facilities per bank
- Total for facilities still available
- All balances linked to facilities (loans, bank, other)
- Keeping into account that limit may be fixed or floating
- Short term / overdraft graph:
- Same as long term, but only display facilities marked as short-term
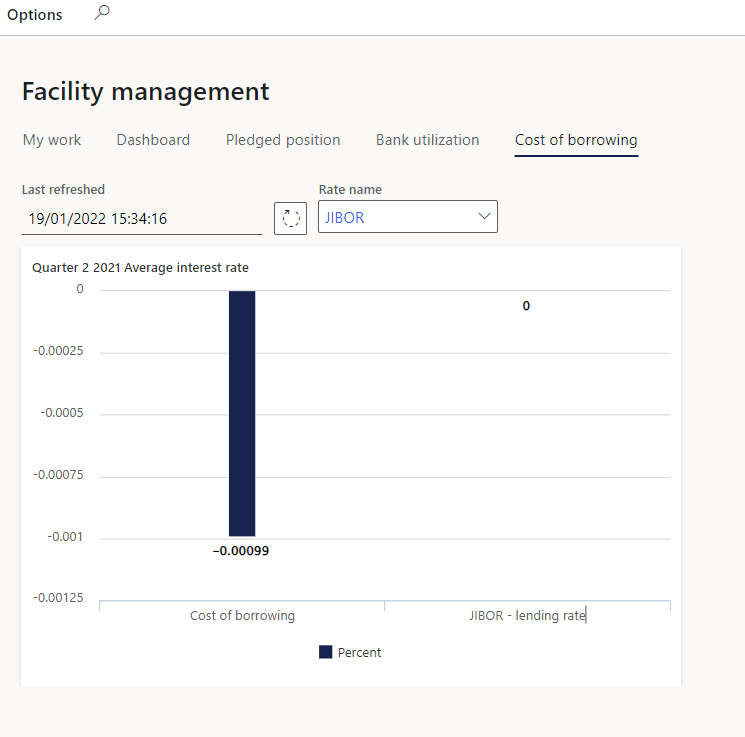
¶ Cost of borrowing tab
- Dashboard indicating total % of cost of funding
- Show calculation for most recent quarter
- Bank rate to be captured in interest rate table, with selection to choose relevant rate.
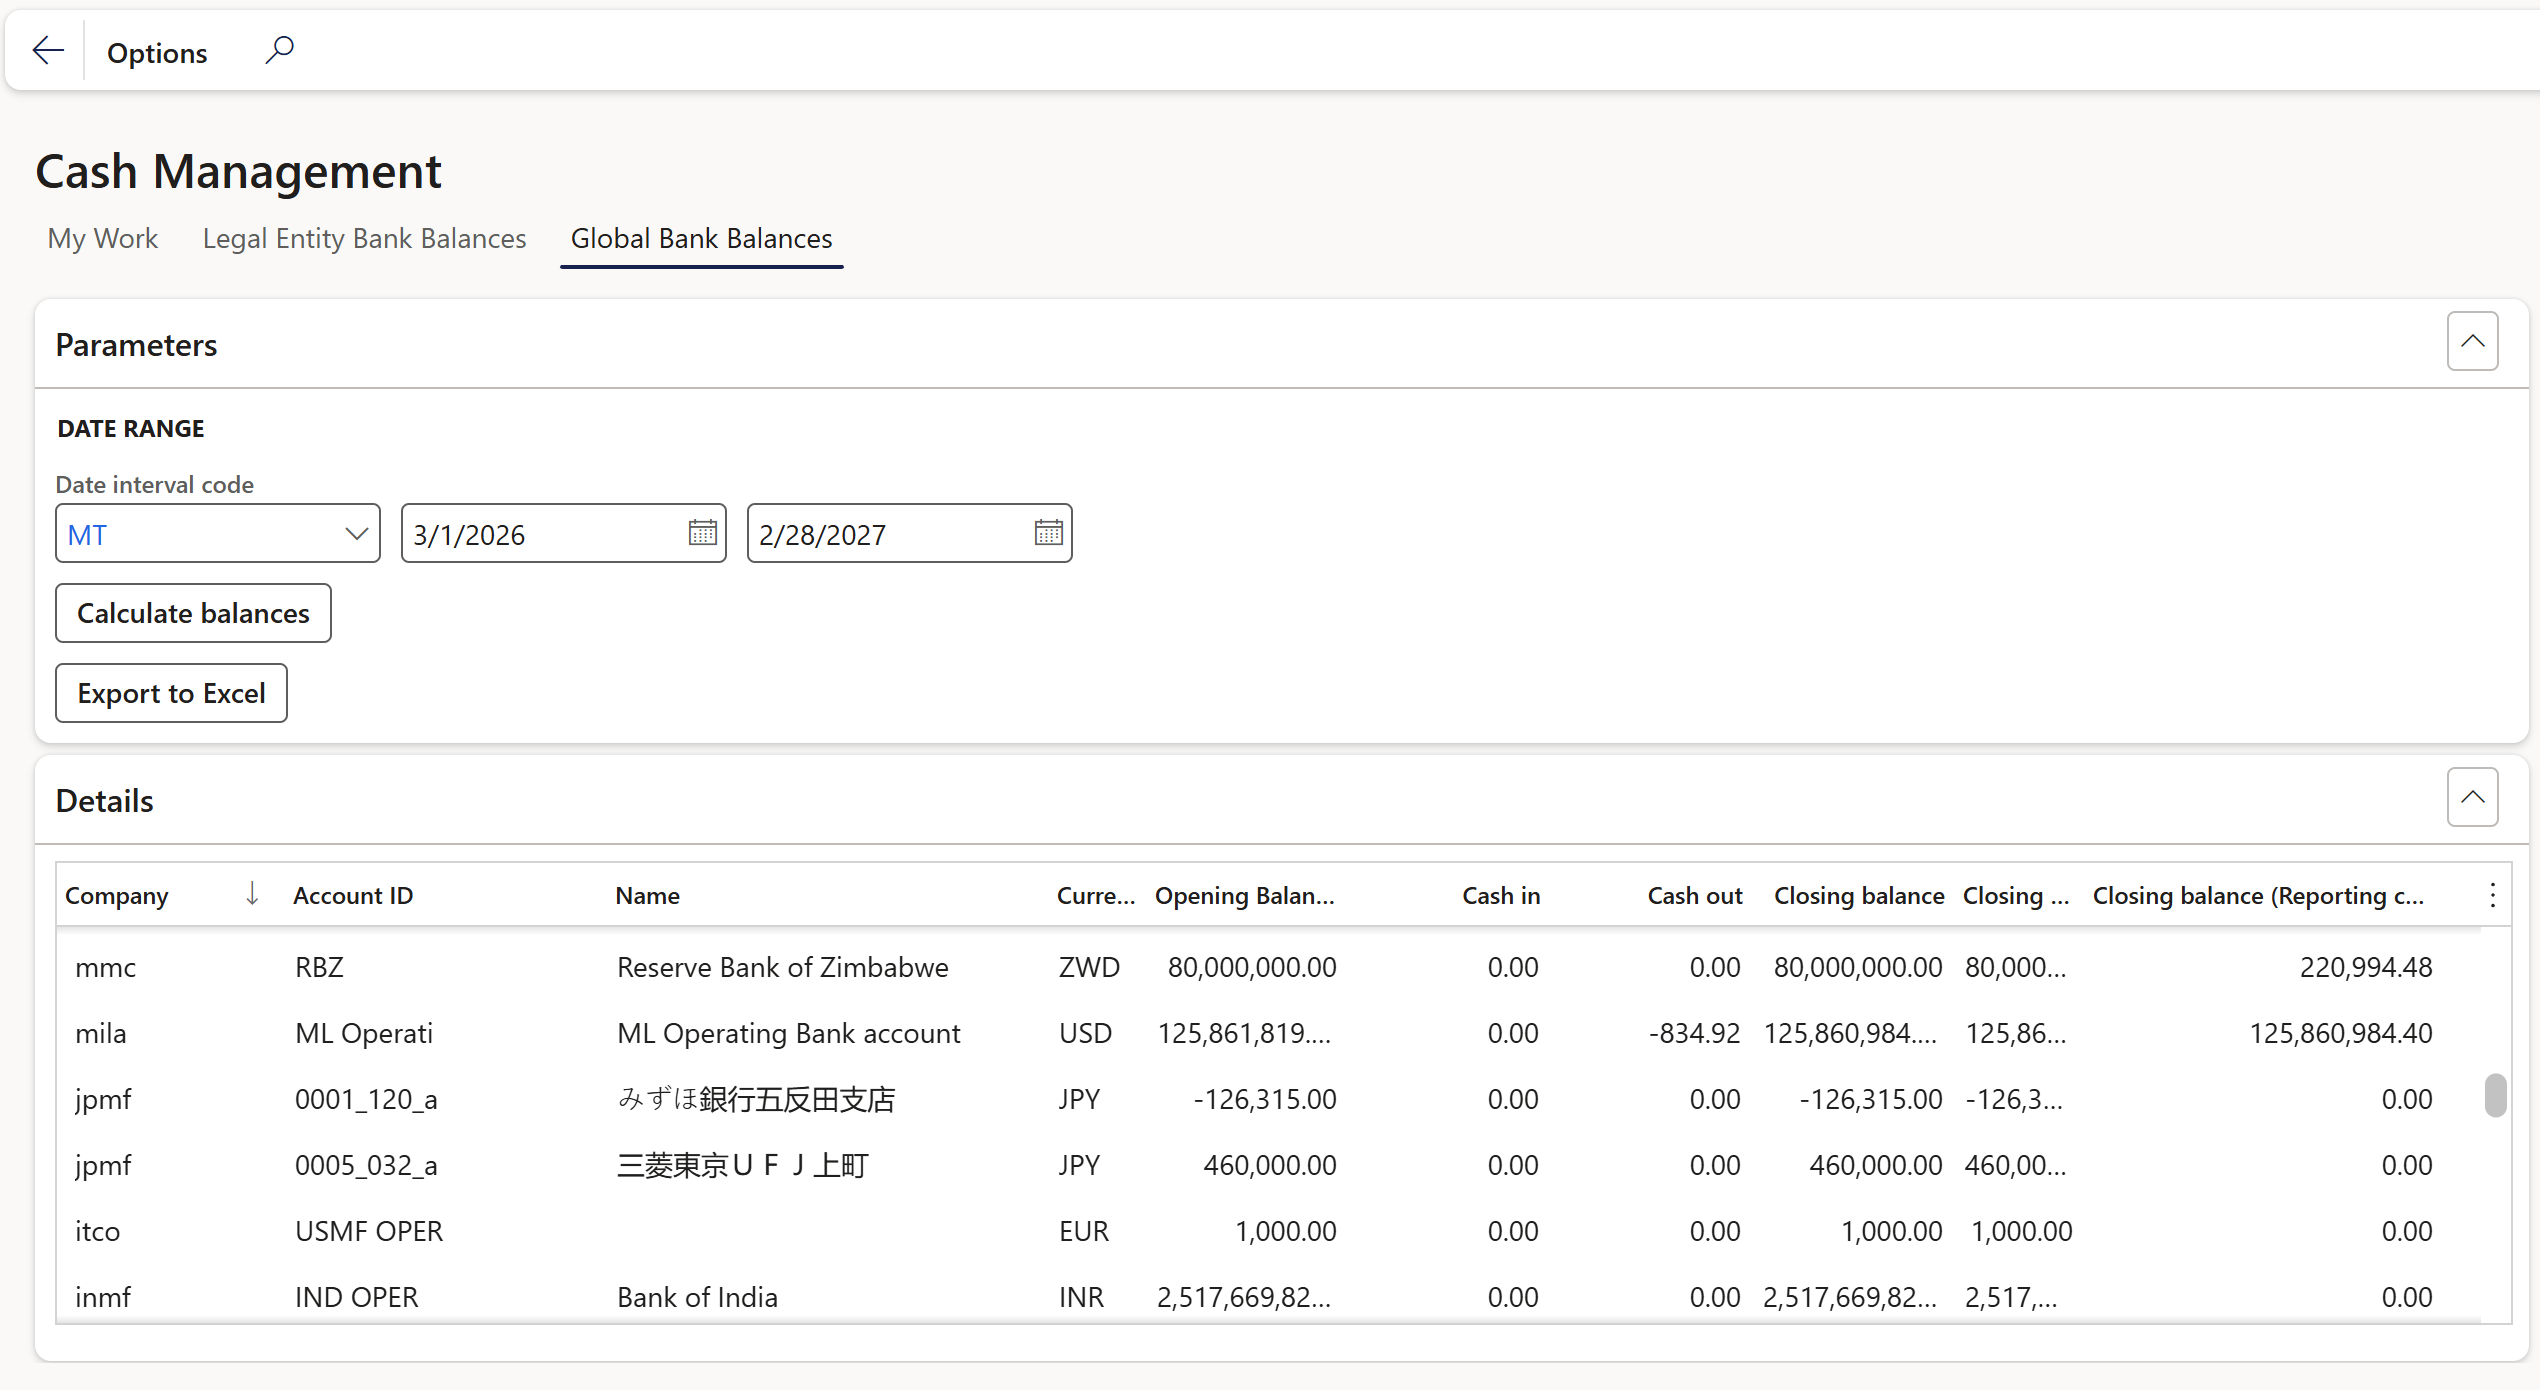
¶ Cash management workspace
Go to: Treasury > Workspaces > Cash management
The following tabs are available:
- My work
- Legal Entity Bank Balances
- Global Bank Balances
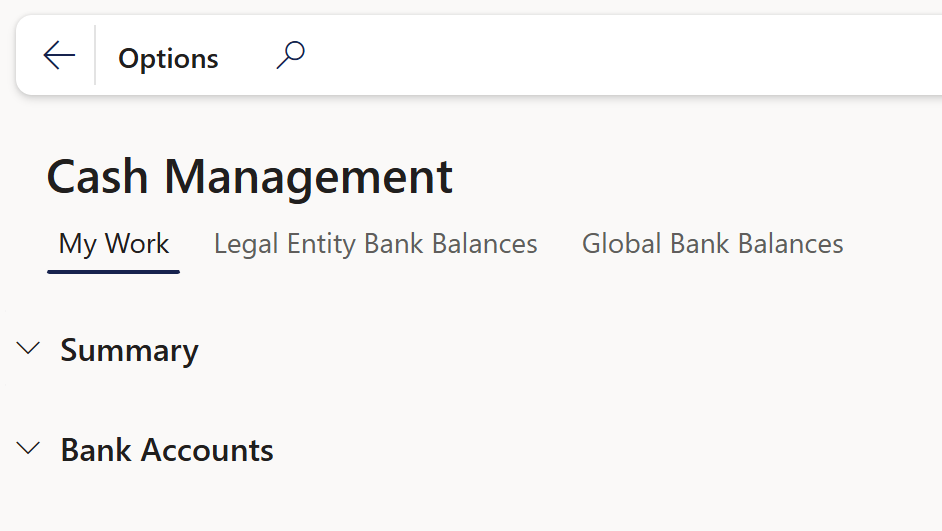
¶ My Work tab
The My Work tab contains the following sections:
- Summary
- Bank accounts
¶ The Summary section consist of two tiles:
- New Bank account
- All Bank Accounts
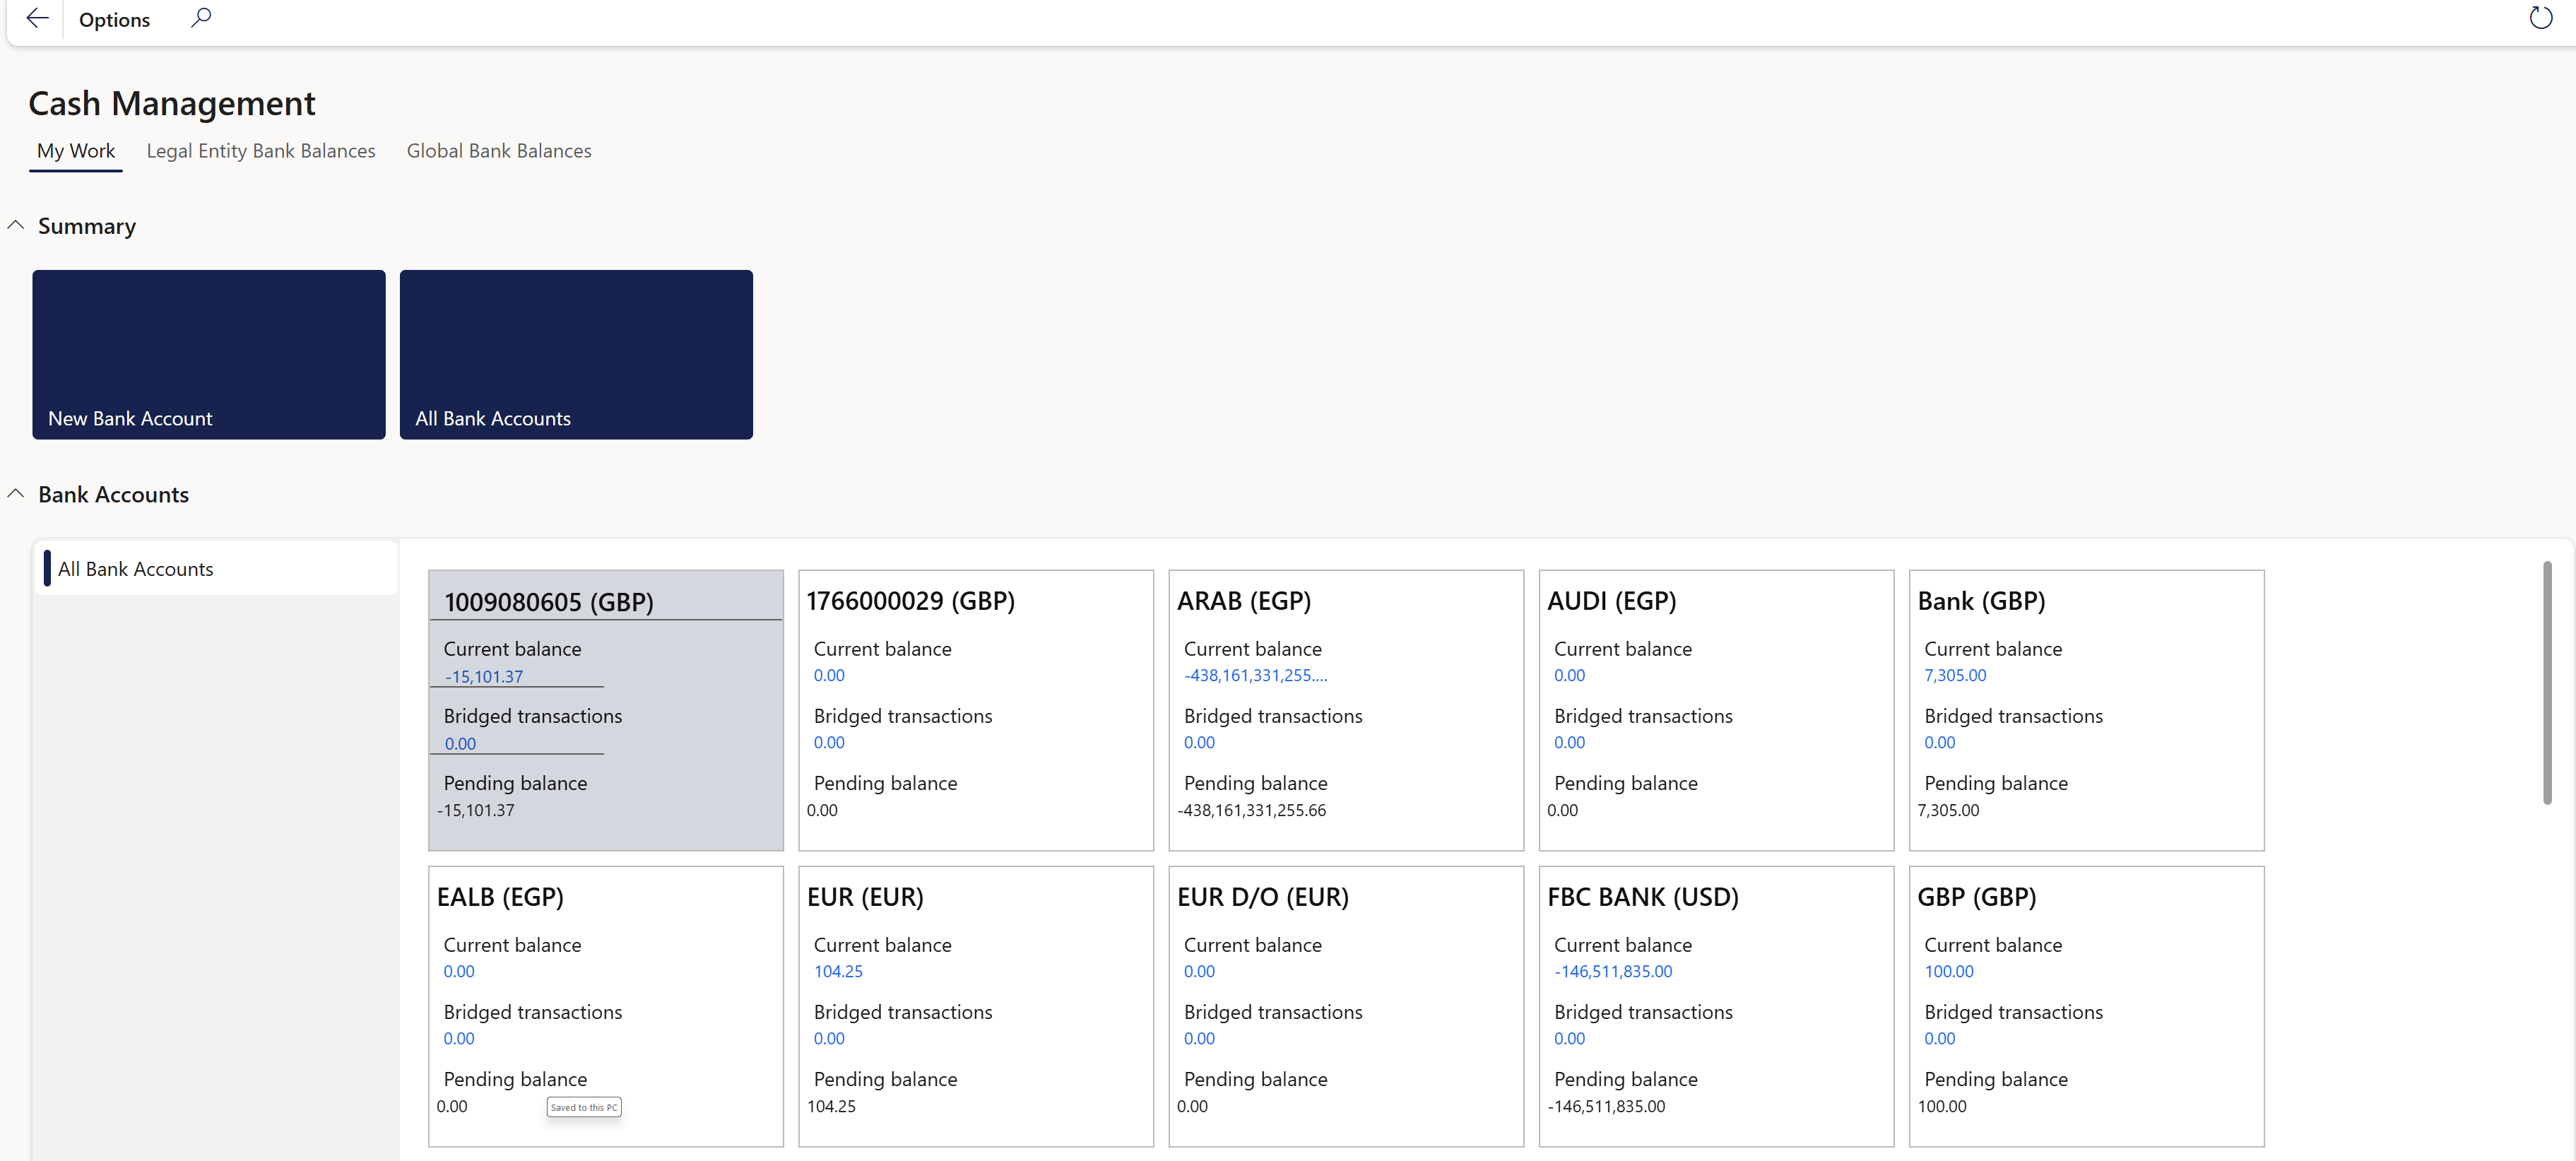
¶ Bank accounts
The Bank accounts section includes multiple tiles, each displaying the following information:
- Bank account number and currency
- Current balance
- Bridged transactions
- Pending balance
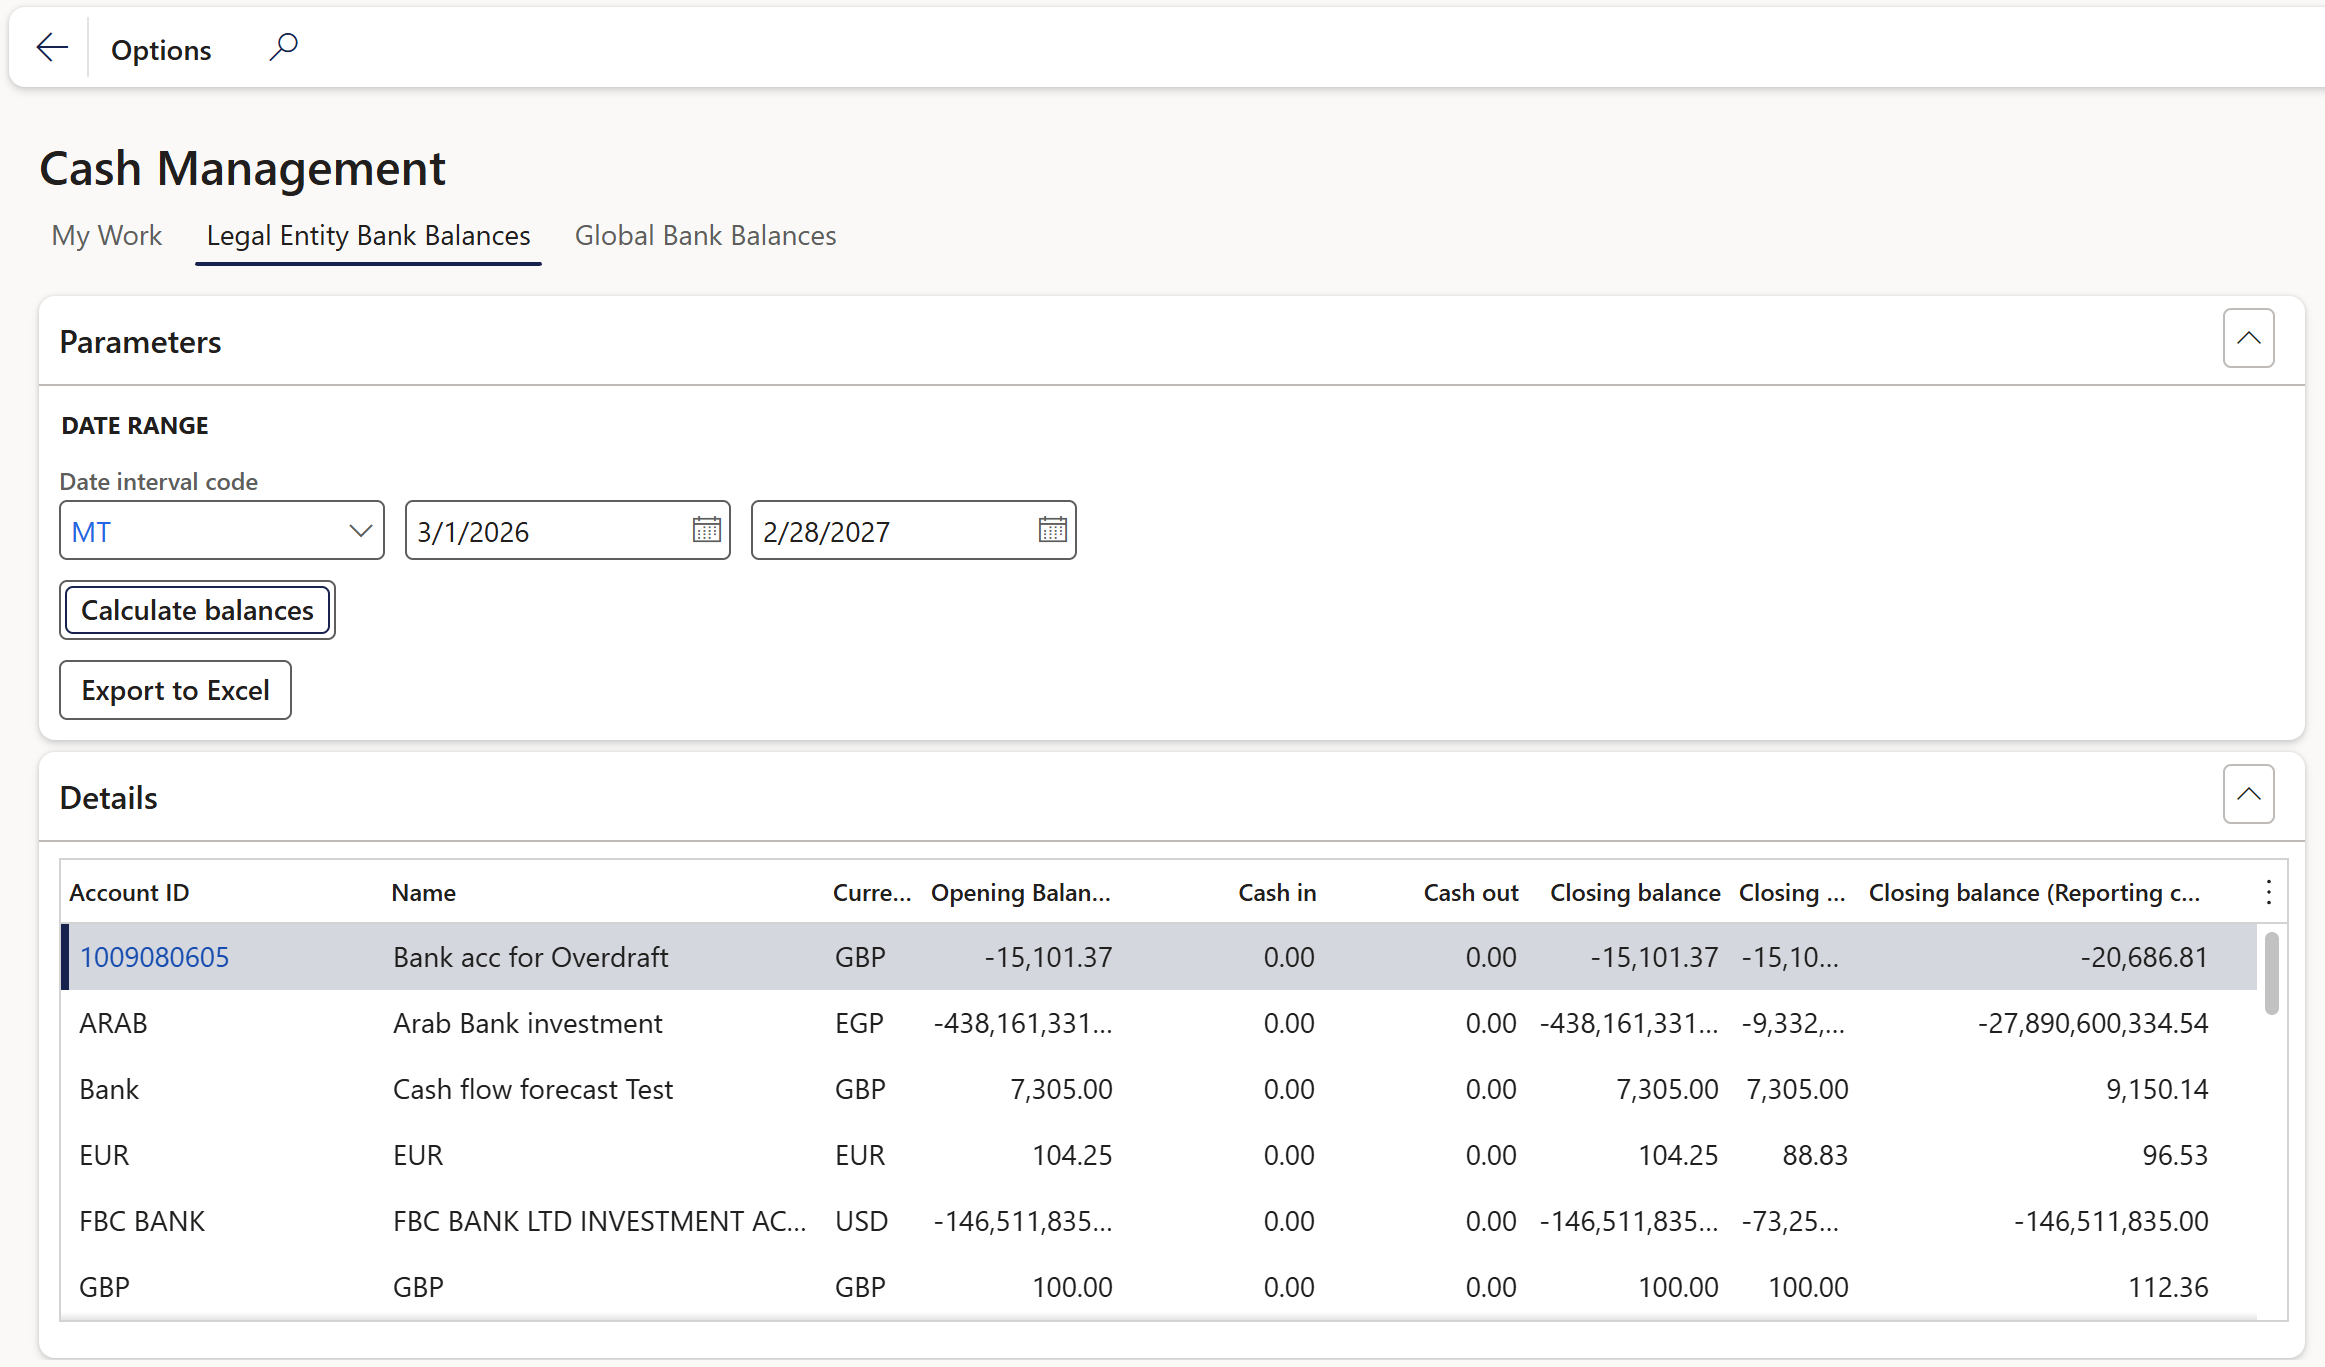
¶ Legal Entity Bank Balances
Legal Entity Bank Balances tab has two FastTabs:
- Parameters
- This is where a date range can be entered, along with a Date interval code, and then the Balances can be calculated. Information can be exported to Excel
- The Details FastTab displays the following columns:
- Account ID
- Name
- Currency
- Opening Balance
- Cash in
- Cash out
- Closing balance (Accounting currency)
- Closing balance (Reporting currency)
¶ Global Bank Balances
The Global Bank Balances tab is similar to the Legal Entity Bank Balances
¶ Loans Inquiries and Reports
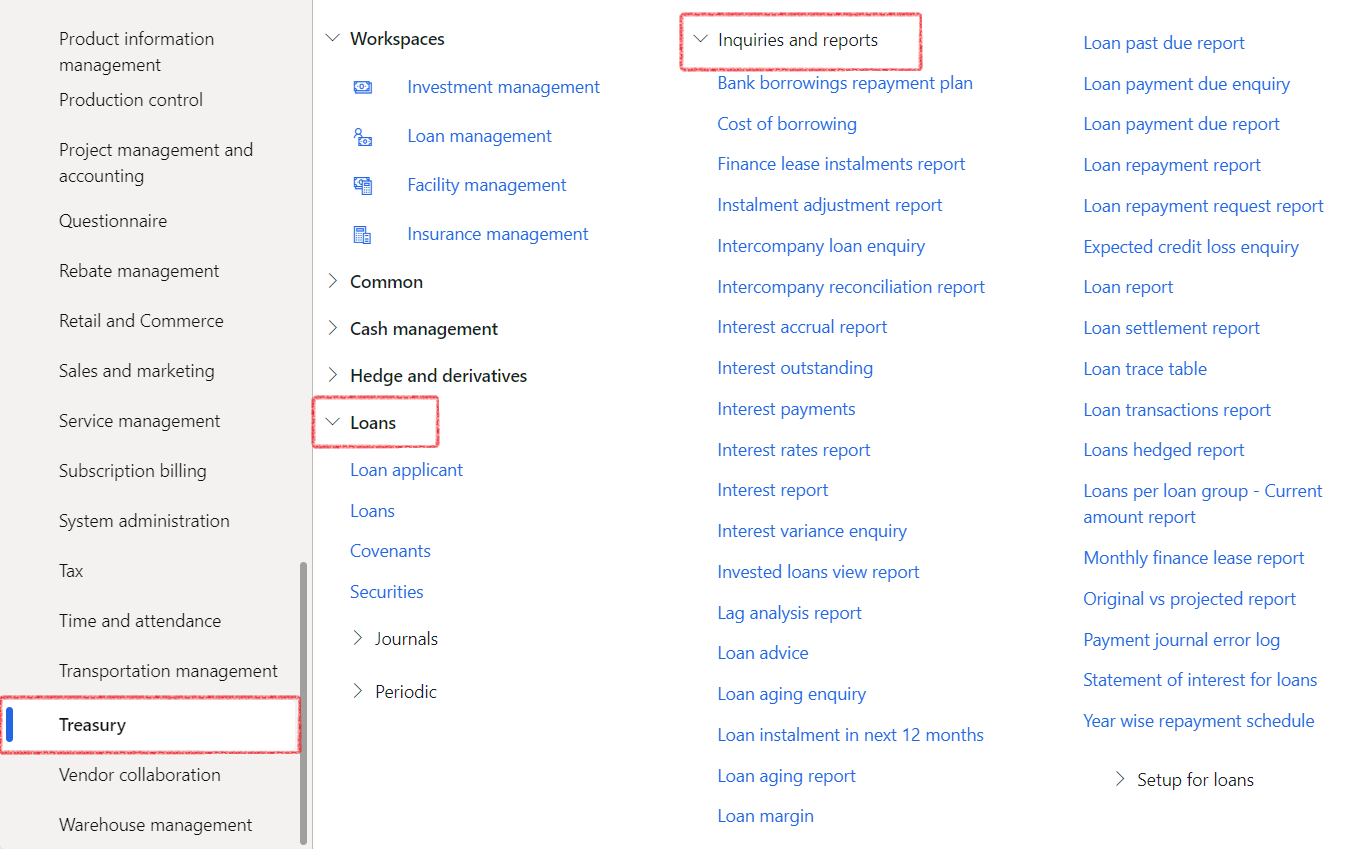
¶ 1. Bank borrowings repayment plan
- Treasury>Loans>Inquiries and reports>Bank borrowings repayment plan
¶ 2. Cost of borrowing
- Treasury>Loans>Inquiries and reports>Cost of borrowing
¶ 3. Finance lease instalments report
The Finance lease instalments report will detail finance lease instalments per loan, number of monthly instalments remaining and the remaining period.
- Treasury>Loans>Inquiries and reports>Finance lease instalments report
¶ 4. Instalment adjutment report
The Instalment Adjustment report will detail differences between proposed instalments (split between interest and capital) and actual instalments
- Treasury>Loans>Inquiries and reports>Instalment adjutment report
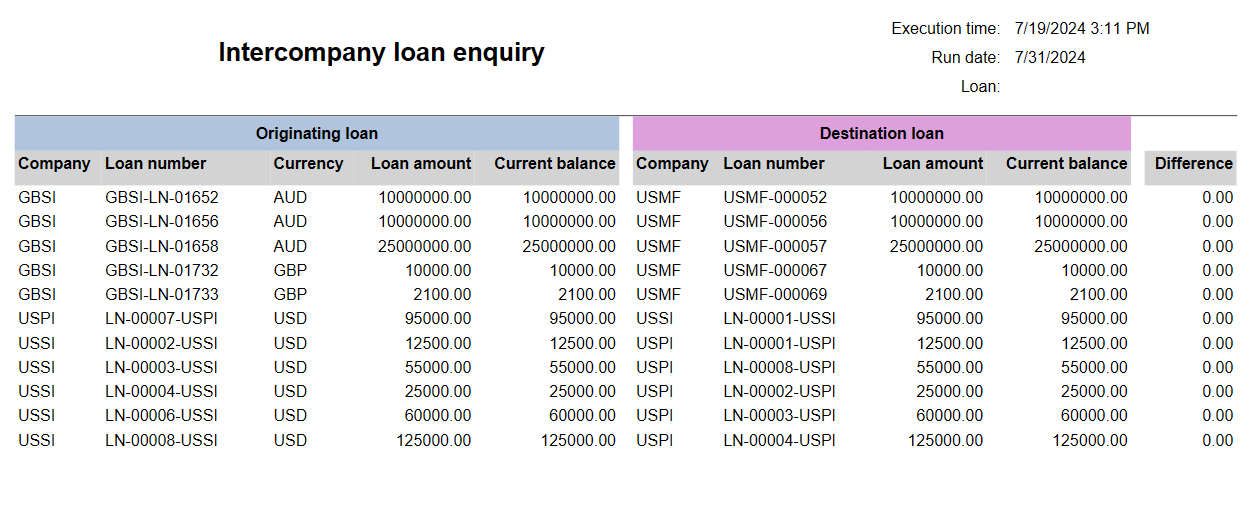
¶ 5. Intercompany loan enquiry
- Treasury>Loans>Inquiries and reports>Intercompany loan enquiry
¶ 6. Intercompany reconciliation report
- Treasury>Loans>Inquiries and reports>Intercompany reconciliation report
¶ 7. Interest accrual report
To access the Interest accrual report, navigate to:
- Treasury>Loans>Inquiries and reports>Interest accrual report
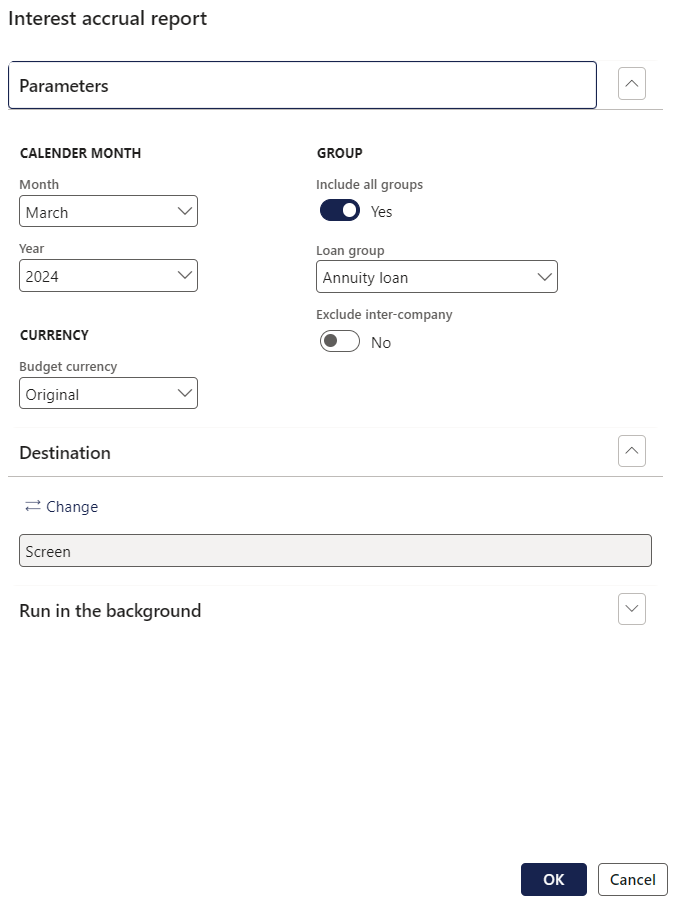
- The dialogue box for generating the interest accrual report will be displayed.
- Select a month from the drop-down menu
- It will only include loans in the report where the end date of the loan is later than the last day of the calendar month selected, for example, if user selects April 2023 in the parameter, it will only include loans with a start date of 1 May 2023 or later
- Select a Year
- Choose a Loan group
- Select a Budget currency
- Click the OK button
The Interest accrual report columns consist of the following:
- Loan group
- Loan number
- Month
- Year
- Interest rate group
- Currency
- Accounting currency amounts
- Interest accrual amount
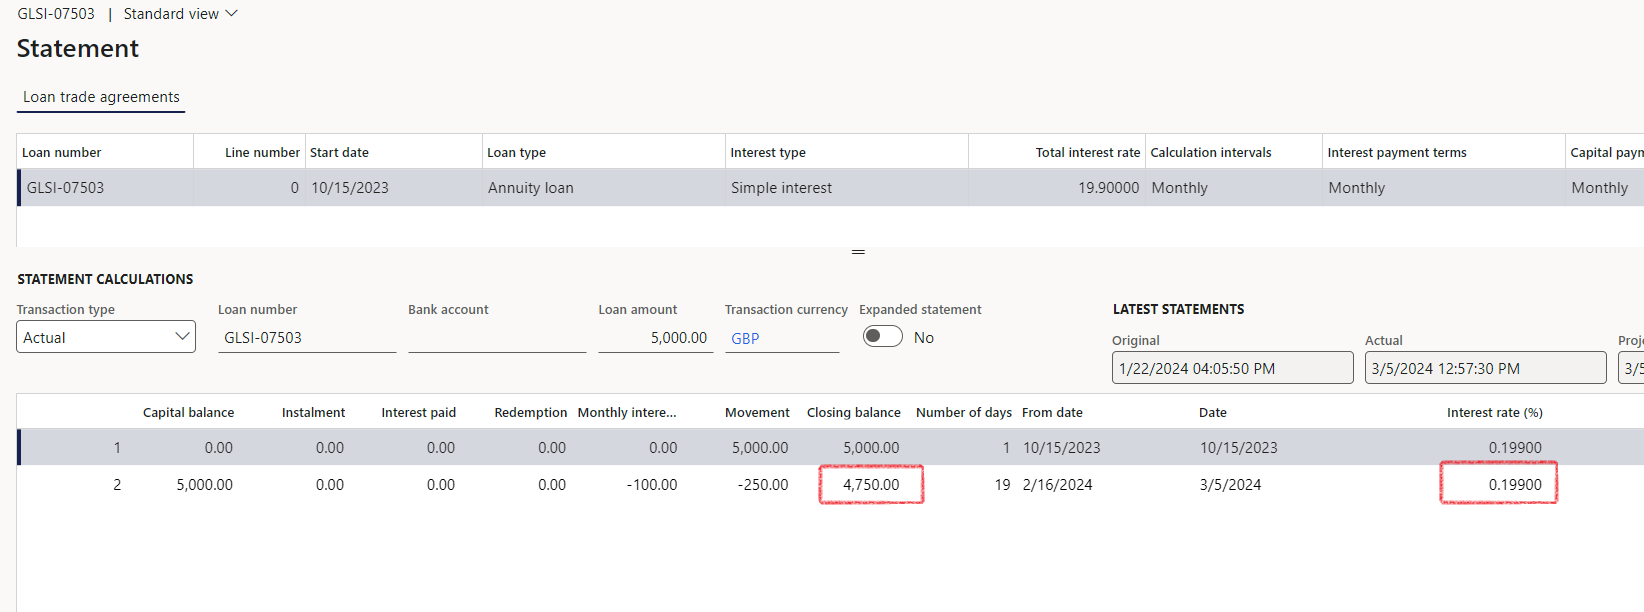
- Calculate interest for the days in the calendar month following the interest accrual date, up to the accounting period end date; for example if the monthly payment and interest accrual date is on the 15th of the month, the interest accrual for April 2023 would be calculated from 16 April 2023 to 30 April 2023 for the loans in the report.
- The formula shown in the Interest accrual column of the report will be:
- Balance multiplied by Daily rate multiplied by Number of days.
- For example, if the loan balance is $4750.00, and the interest rate is 19.9% for the month of March, with 27 remaining days, the calculation will be performed as follows:
4750 x 19.9% / 365 x 27 = 69.92

¶ 8. Interest outstanding
- Treasury>Loans>Inquiries and reports>Interest outstanding
¶ 9. Interest payments
- Treasury>Loans>Inquiries and reports>Interest payments
¶ 10. Interest rates report
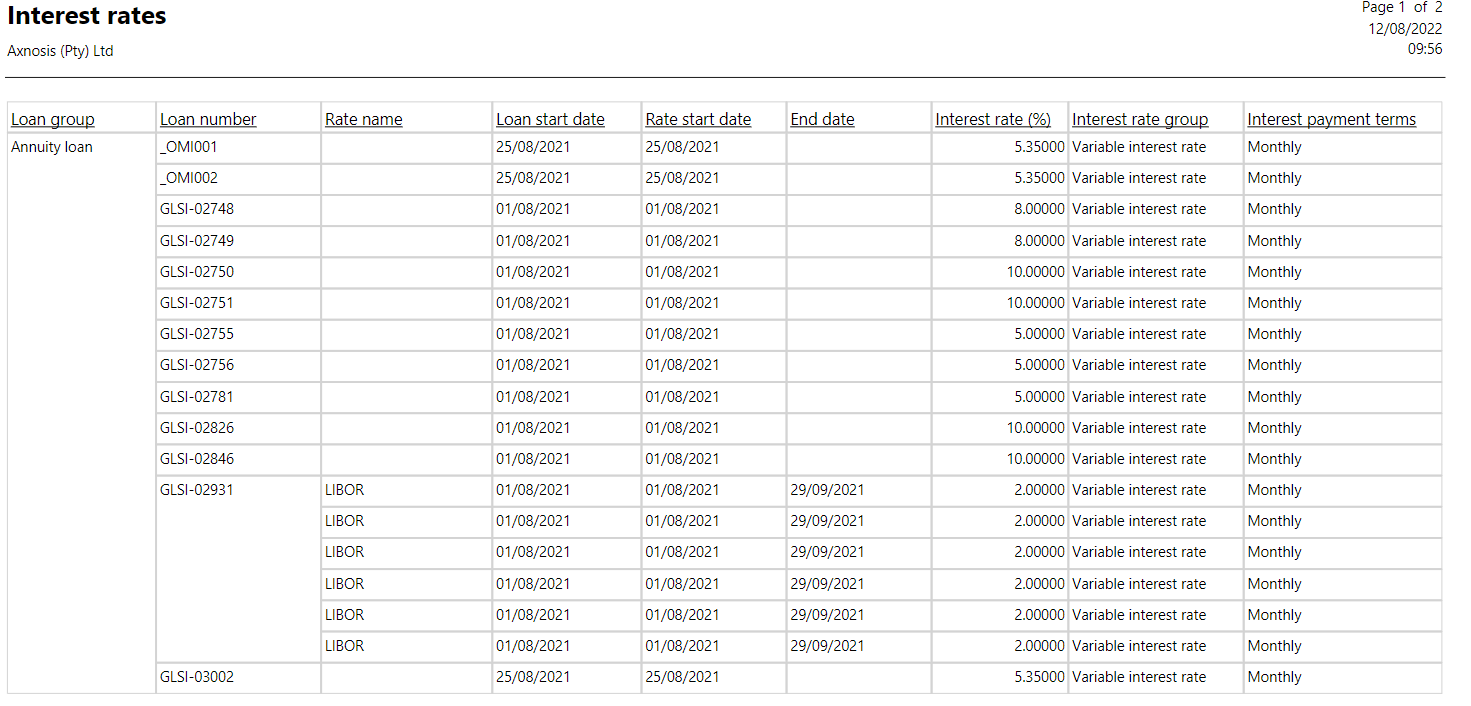
The Interest rates report will detail the current interest rate applicable to each loan
- Treasury>Loans>Inquiries and reports>Interest rates report
¶ 11. Interest report
- Treasury>Loans>Inquiries and reports>Interest report
¶ 12. Interest variance enquiry
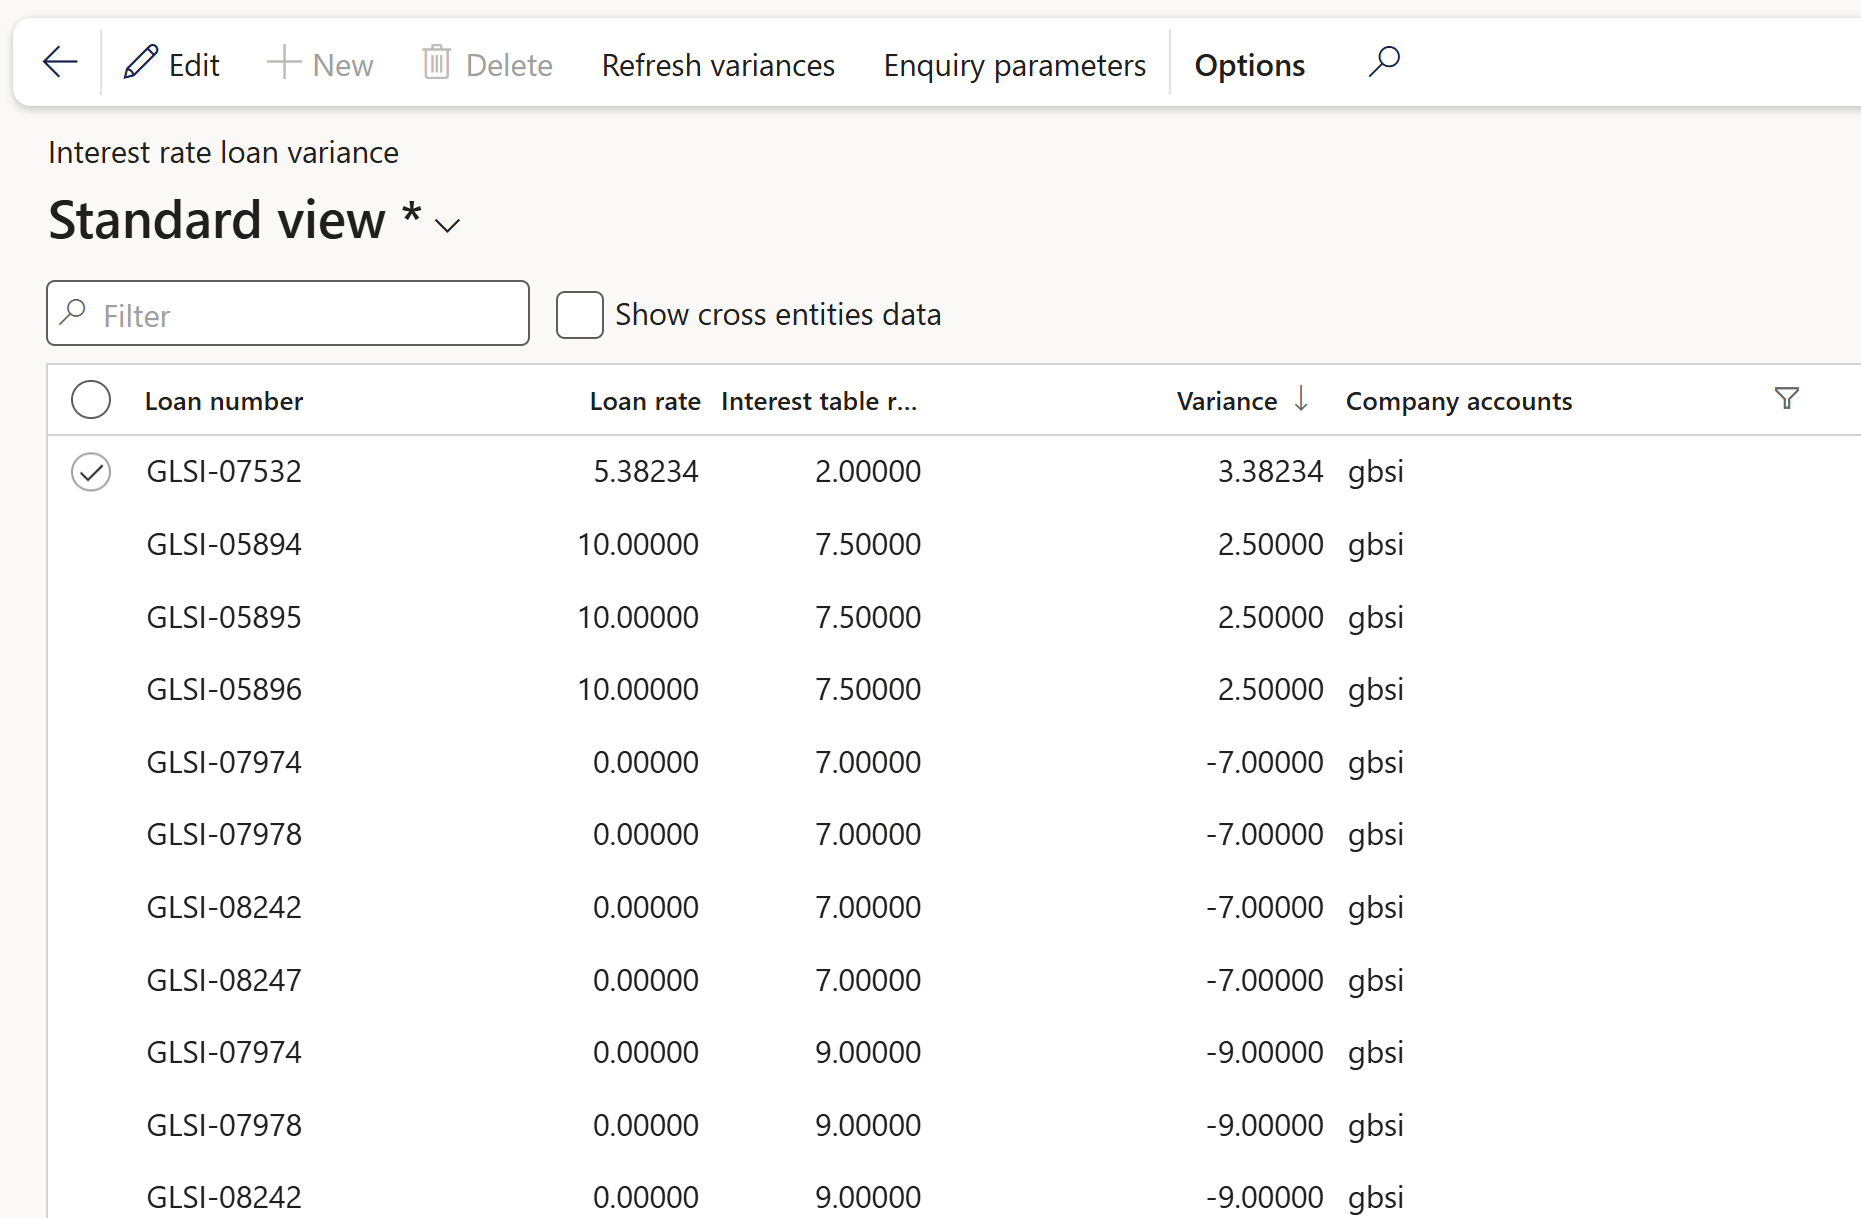
- Treasury>Loans>Inquiries and reports>Interest variance enquiry
The Interest variance enquiry consist of the following columns:
- Loan number
- Loan rate
- Interest table rate
- Variance
- Company accounts
¶ 13. Invested loans view report
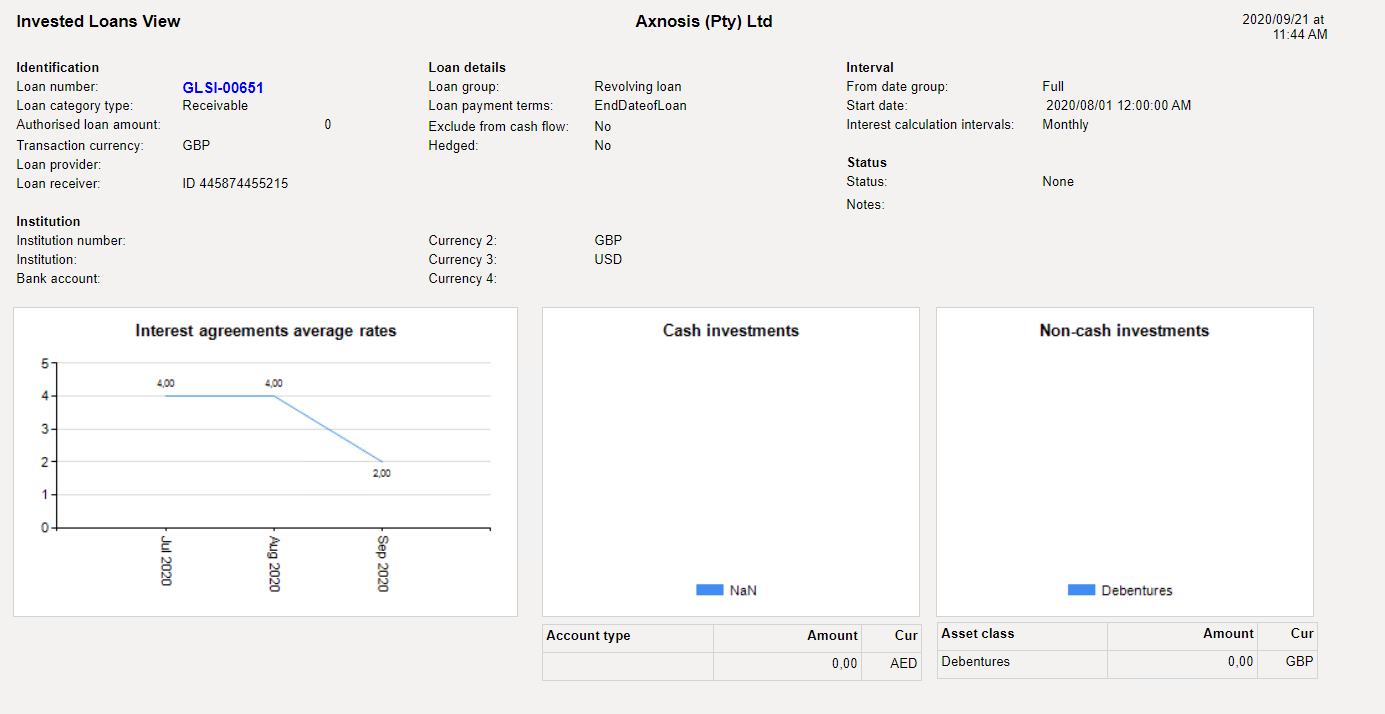
The Invested Loans view report will display the value of investments that’s been made with the funds originating from specific loans
- Treasury>Loans>Inquiries and reports>Invested loans view report
¶ 14. Lag analysis report
Treasury>Loans>Inquiries and reports>Lag analysis report
¶ 15. Loan advice
The Loan Advice report shows the loan application details
- Treasury>Loans>Inquiries and reports>Loan advice
¶ 16. Loan aging enquiry
- Treasury>Loans>Inquiries and reports>Loan aging enquiry
¶ 17. Loan instalment in next 12 months
- Treasury>Loans>Inquiries and reports>Loan instalment in next 12 months
¶ 18. Loan Instalment Term Split
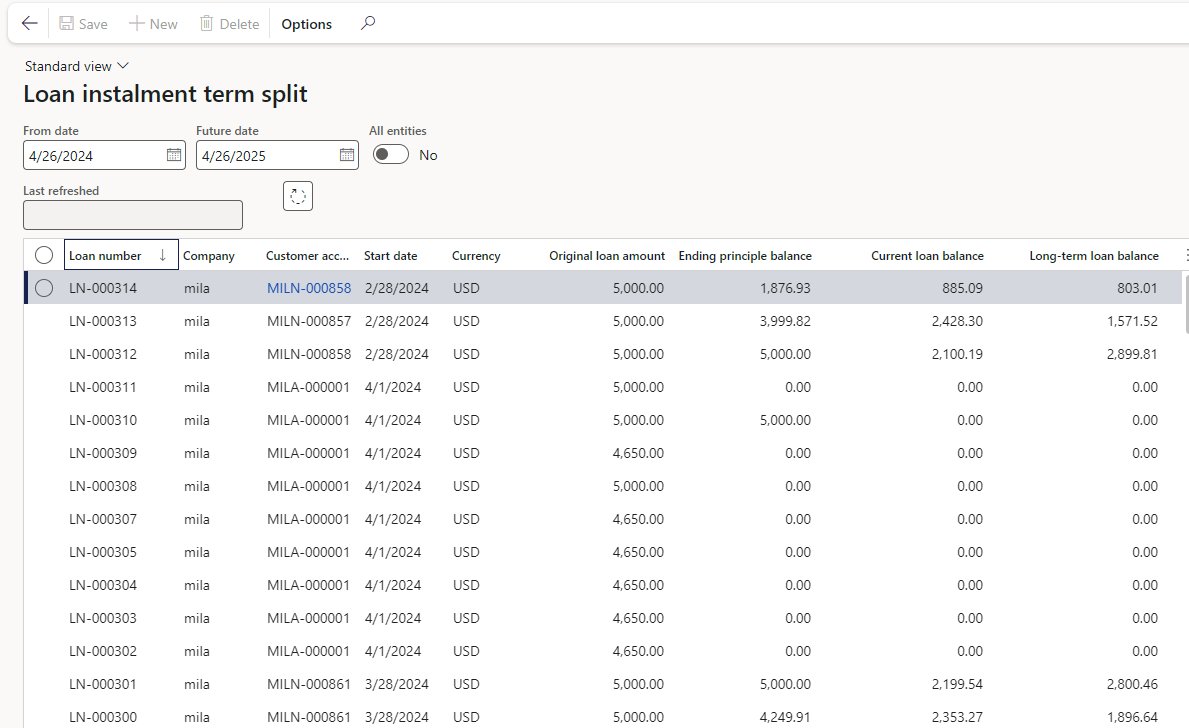
Current versus Long-term Loan Balances will be displayed on this inquiry.
At the top of the inquiry page, there are selection boxes for both a From date and a Future date.
By utilizing these dates, the report calculates both the current loan balance and the long-term loan balance.
The current loan balance specifically encompasses all principal redemptions made between the start date and the future date.
Data for this report primarily originates from the Projected Loan Statement.
If Date is backdated (before today's date), no actual instalments will be used for the calculation of the current value.
The original instalment amount will be used, up to the point where projected statement starts (usually current month).
Long-term loan balance will be the difference between Ending Principal value less current loan amount.
The normal projected instalment amount will be used for the remainder of the current loan amount
This report can easily be exported to Excel.
If the Date is backdated, no actual instalments will be used for the calculation of the Current loan balance
The original instalment amount will be used, up to the point where the projected statement starts (usually the current month)
The normal projected instalment will be used for the remainder of the Current loan balance
Long-term loan balance is the difference between the ending principal value less the current loan amount.
- Navigate to: Treasury > Loans > Inquiries and Reports > Loan Instalment Term Split
- The enquiry consists of the following columns:
- Loan number
- Company
- Customer account
- Start date
- Currency
- Original loan amount
- Ending principal balance: The Ending principle balance indicates the actual loan balance as at the From date
- Current loan balance
- The current loan balance incorporates the next 12 months of principal payments from the report's date. The Current loan balance indicates all expected principal payments between the From and Future date
- It differs from the installment amount as it excludes interest.
- Long-term loan balance
- This figure represents the ending principal balance subtracted from the current loan balance as of the selected report generation date.
¶ Loan Instalment Term Split Report
This is the report format of the Loan instalment term split inquiry.
This report can be executed in a batch mode.
A Yes/No toggle labelled All entities is available under the Parameters FastTab in the report dialog.
The Destination FastTab includes the following options:
- Print archive
- Screen
- Printer
- File
Dates type
- Use chosen dates: The "From date" and "To date" selection will be used
- Use system dates: The "From date" will default to the System date and one year will be added for the "To date"
- Use end of Previous month: The "From date" will default to the last day of the prior month, and one year will be added for the "To date"
If the current loan balance exceeds the ending principal balance, it will automatically be adjusted to match the ending principal balance. This ensures the long-term loan balance does not fall into a negative value.
¶ 19. Loan aging report
The data source for this report will come from the Actual and Projected TMS loan statements. The balance on this report is calculated by subtracting the actual installments from the expected installments.
- Navingate to: Treasury>Loans>Inquiries and reports>Loan aging report
- Choose between Accounting or Reporting currency
- Select an Aging period definition
- Choose Yes or No to Print the aging period description
- Select a Balance as at date
¶ 20. Loan margin
The Loan Margin will show the Cover ratio, Outstanding balance, Pledged amount, and Variance per loan type
- Treasury>Loans>Inquiries and reports>Loan margin
¶ 21.Loan outstanding enquiry
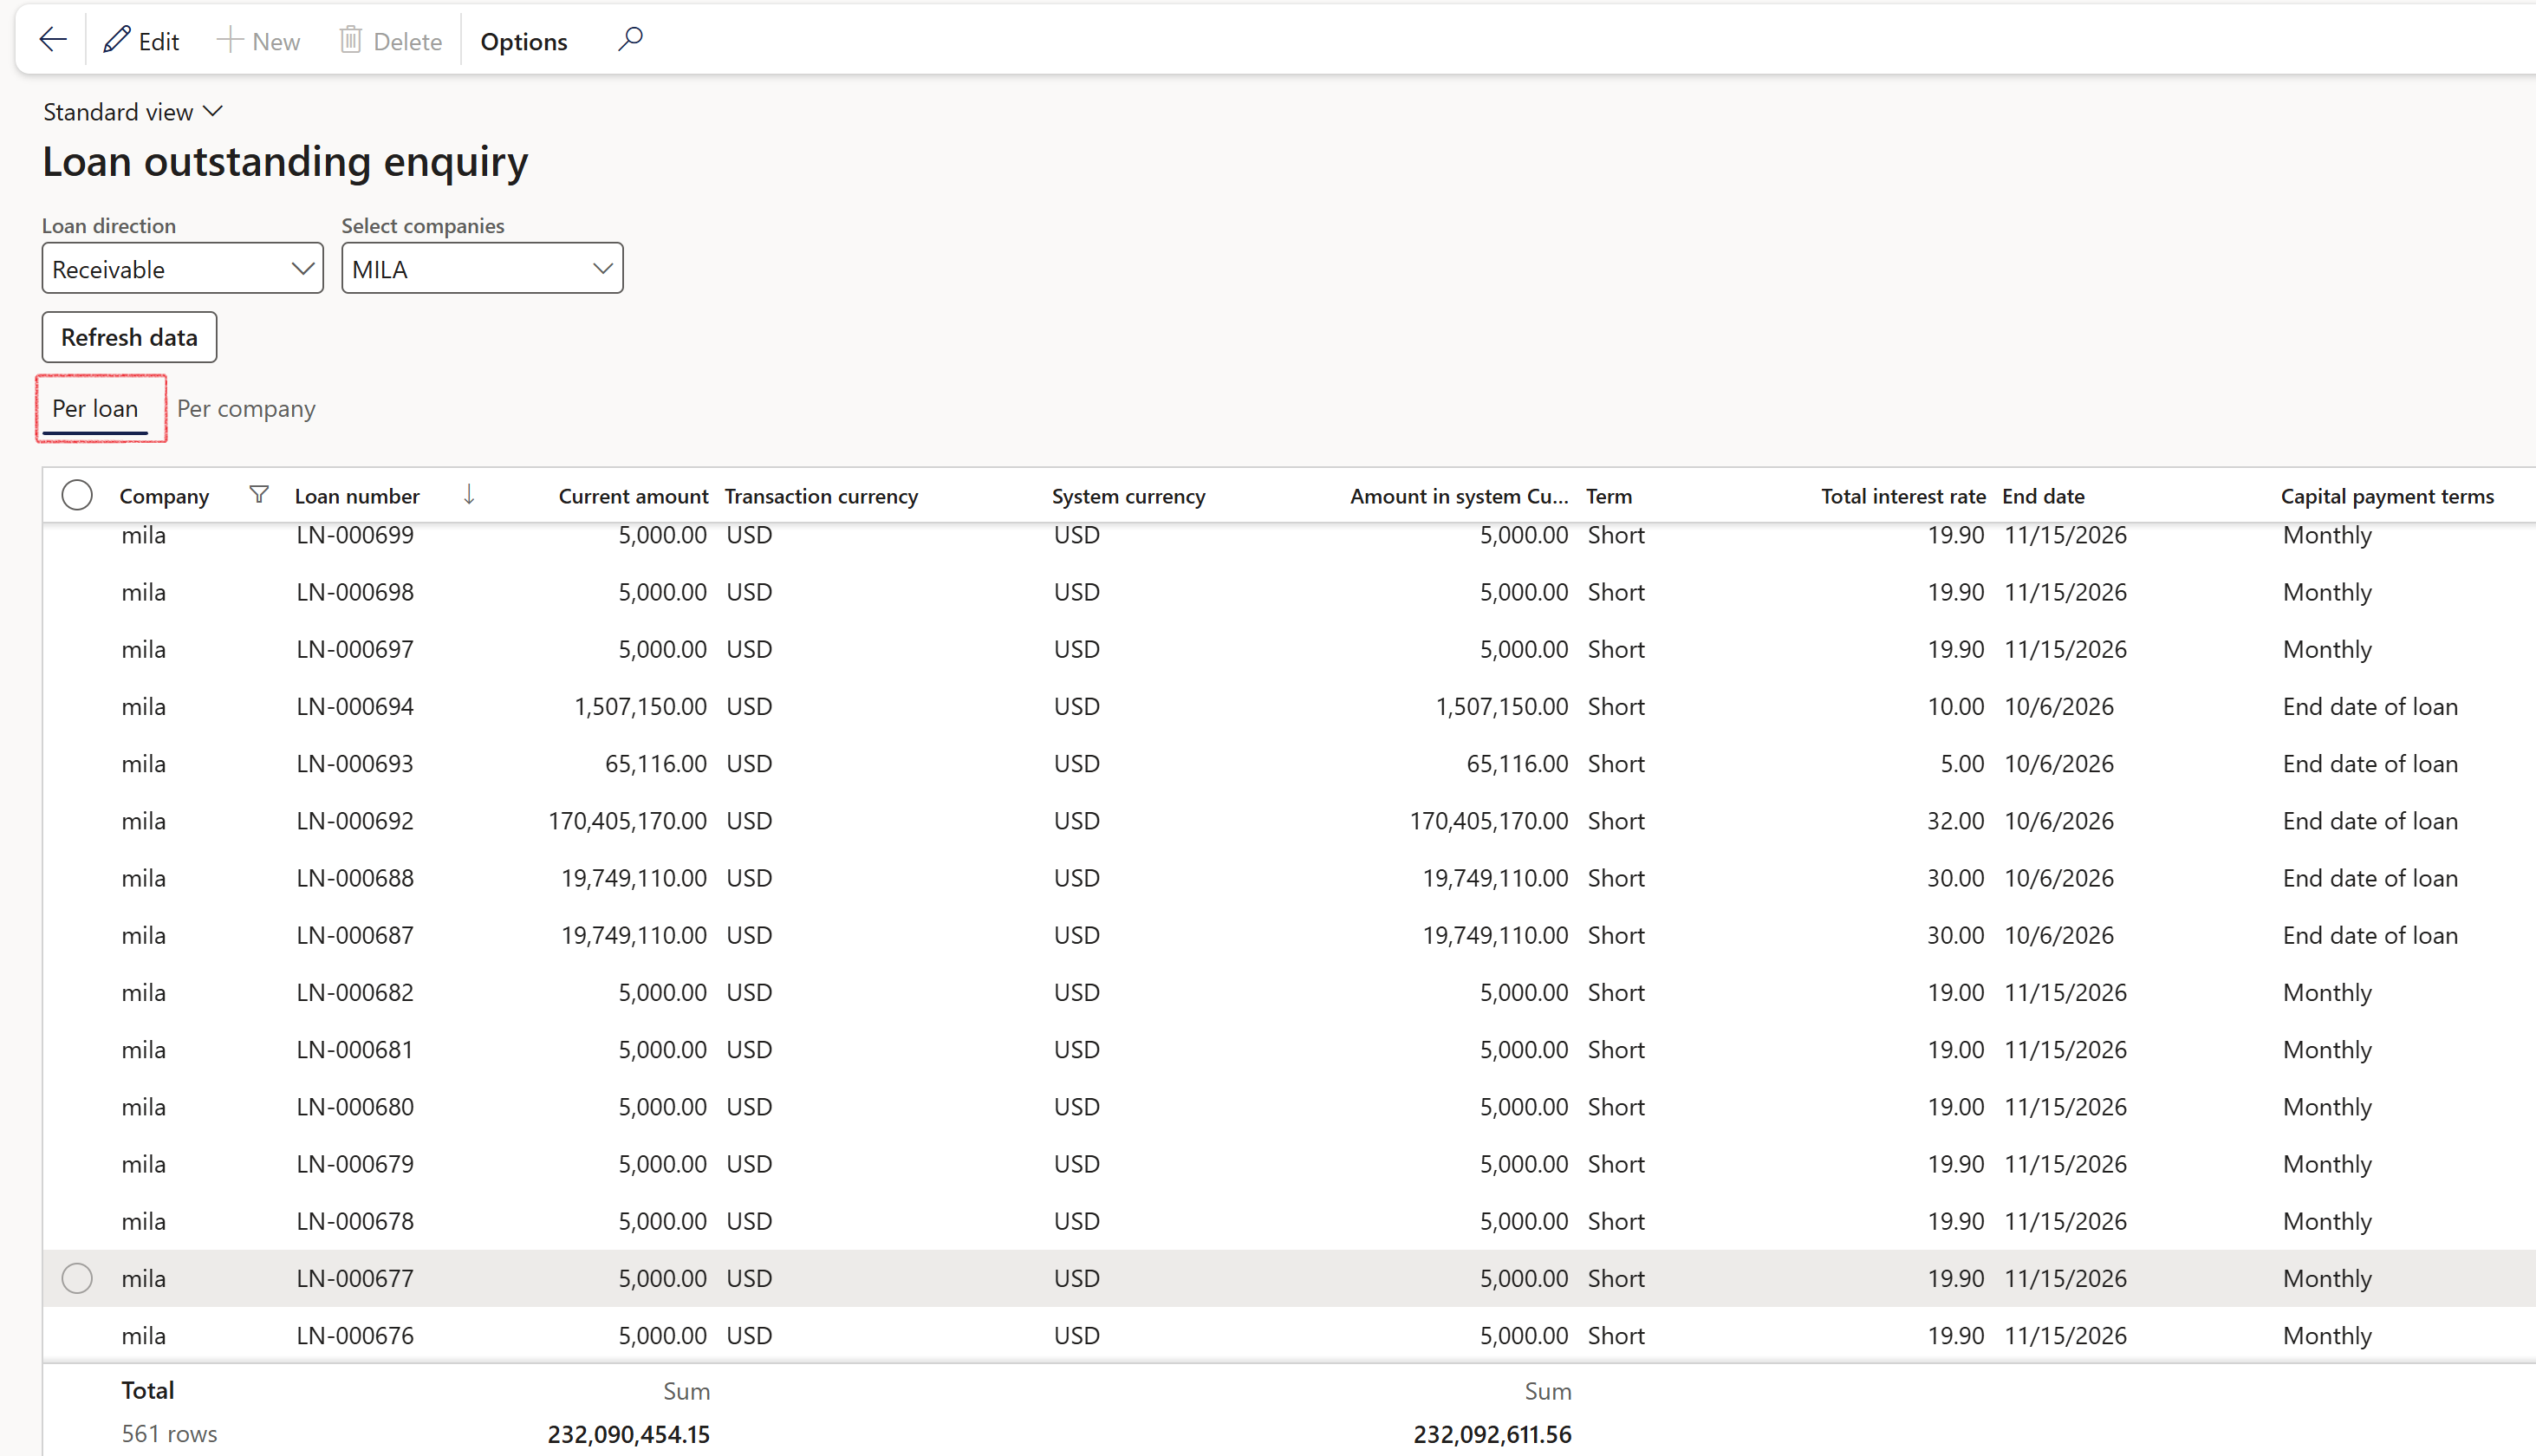
The Loan Outstanding Enquiry allows for the selection of the loan category type, which can be either Payable or Receivable.
The enquiry consists of the following column headings:
- Company
- Loan number
- Current amount
- Transaction currency
- System currency
- Amount in system currency
- Term
- Latest interest rate
- End date
- Capital payment terms
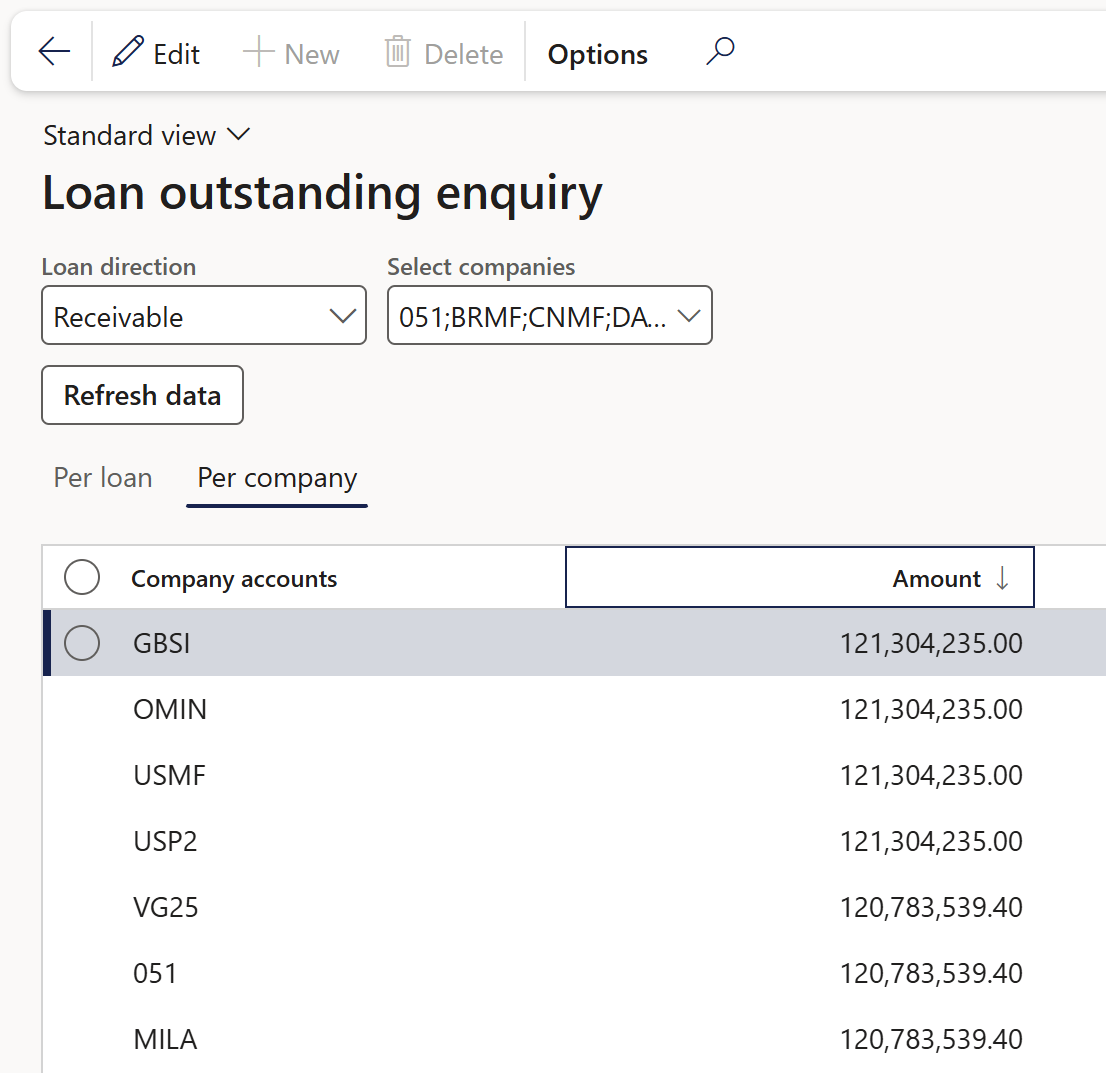
The Select Companies drop-down menu allows users to choose from the following options to view data:
- One specific company
- Multiple companies
- All companies
A Refresh data button is provided to populate the relevant data for the enquiry. The report can display Loans Outstanding either Per Loan or Per Company
¶ 22. Loan past due report
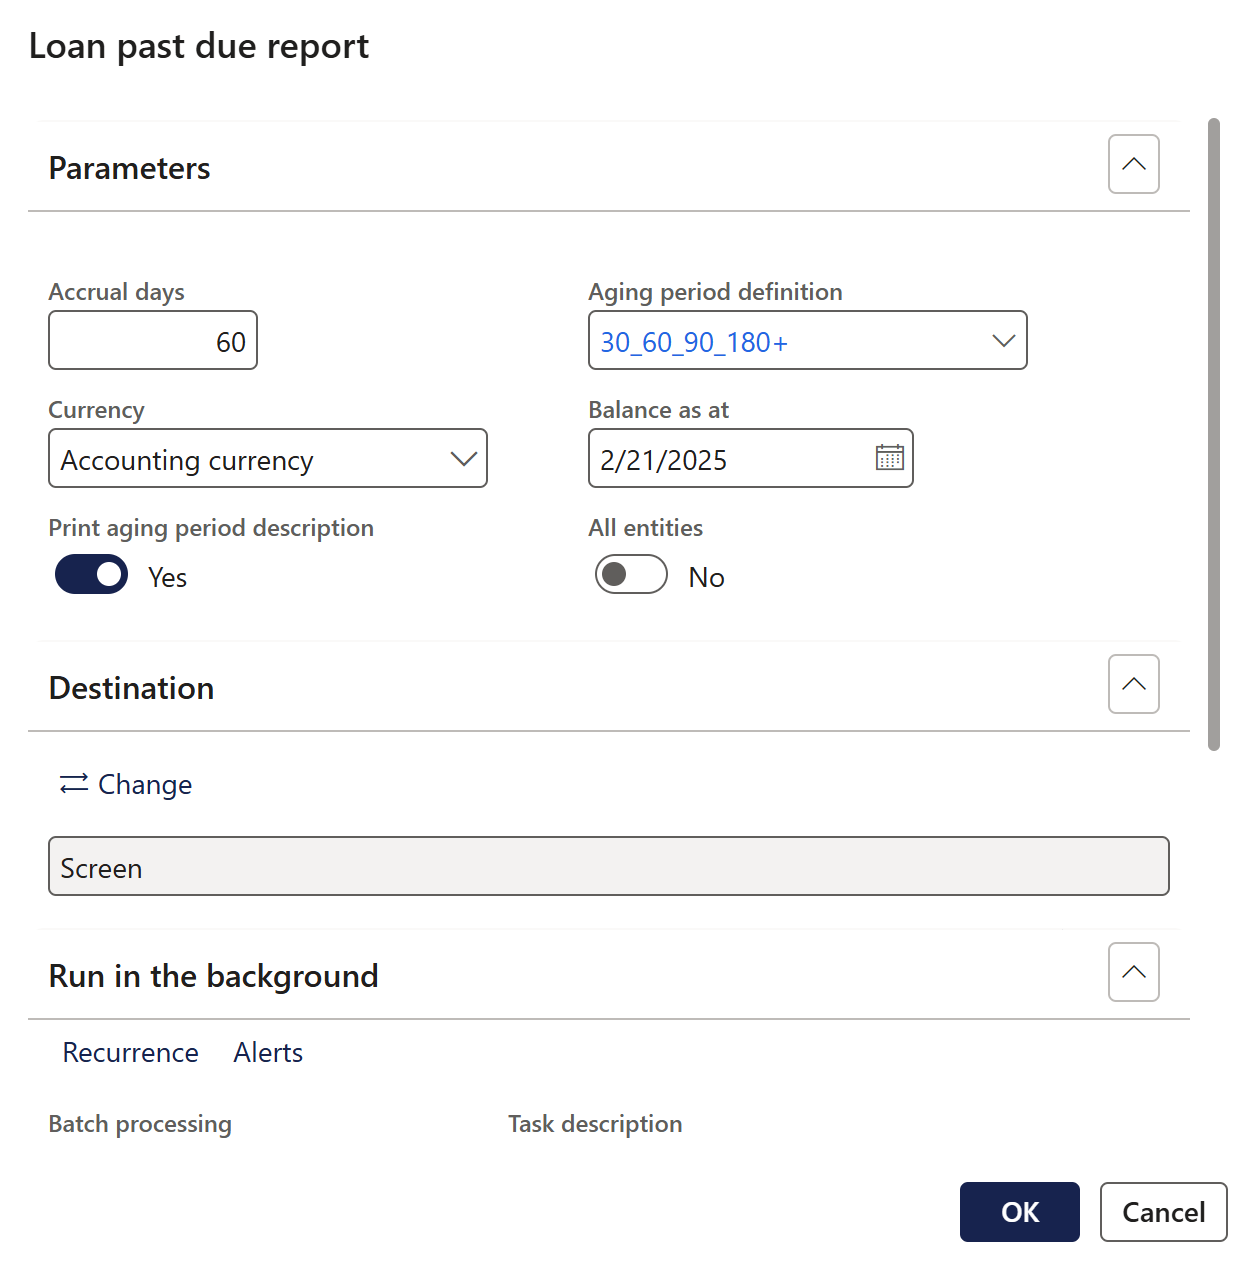
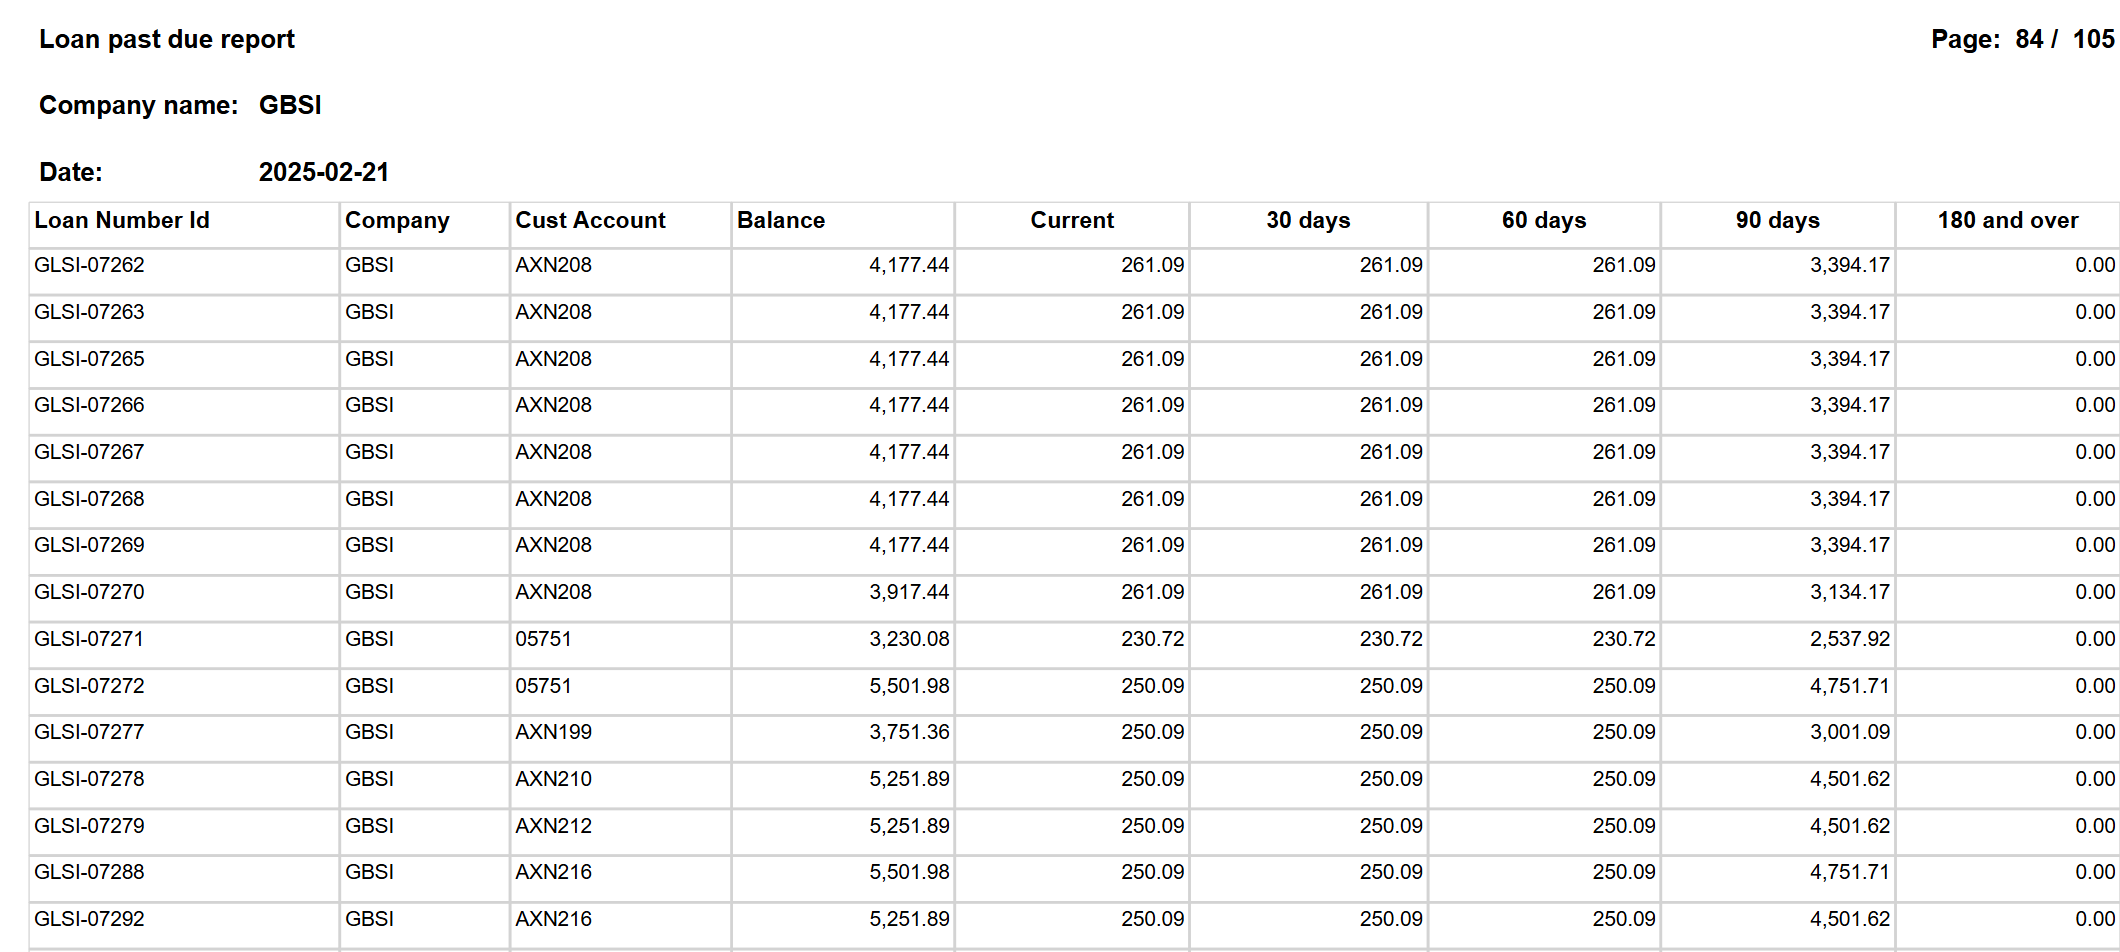
The Loan past due report resembles the Loan ageing report, with an added filter named accrual days, which essentially represents the outstanding days.
In the Loan past due print dialogue, users have the option to either print ageing period descriptions or use dates as column headings.
A multi-company option is available in the report parameters dialogue.
- Treasury>Loans>Inquiries and reports>Loan past due report
¶ 23. Loan payment due enquiry
Treasury>Loans>Inquiries and reports>Loan payment due enquiry
¶ 24. Loan payment due report
The Loan Payments due report will indicate the listing of instalments and due dates per loan. Can utilise this report to inquire on payments due within a certain date period. The report provides a listing of all loan payments due, withing specific period.
On the Loan payments due report, there is a validation to ensure the “From date” is never dated before the current date (today’s date), because the Loan payment due report looks at the Projected loan statement amounts.
- Treasury>Loans>Inquiries and reports>Loan payment due report
¶ 25. Loan repayment report
The Loan Repayment report is a remittance to the bank for loan repayments
- Treasury>Loans>Inquiries and reports>Loan repayment report
¶ 26. Loan repayment request report
The Loan Repayment Request report is an instruction to the bank for loan advances to third parties
- Treasury>Loans>Inquiries and reports>Loan repayment request report
¶ 27. Expected credit loss enquiry
- Treasury>Loans>Inquiries and reports>Expected credit loss enquiry
¶ 28. Loan report
The Loan report provides a summary of all loans where the loan start date is within a specified date range
- Treasury>Loans>Inquiries and reports>Loan report
¶ 29. Loan settlement report
The Loan Settlement report will produce a letter to the bank with instruction for final settlement
- Treasury>Loans>Inquiries and reports>Loan settlement report
¶ 30. Loan trace table
- Treasury>Loans>Inquiries and reports>Loan trace table
¶ 31.Loan transactions report
The data source for this report is the Loan data table.
The transaction type for this report is set to actual (i.e. only posted transactions is shown).
- Navigate to: Treasury>Loans>Inquiries and reports>Loan transactions report
Column headings include:
- Loan number
- Transaction date
- Transaction type
- Amounts to use
- Currency
- Amount in transaction currency
- Total (CUR)
¶ 32.Loans hedged report
The Loan hedged report reflects the loans that have been designated as a hedging item in a hedging relationship.
- Treasury>Loans>Inquiries and reports>Loans hedged report
¶ 33. Loans per loan group - Current amount report
The Loans per loan group – Current amount report will display the balance per loan, summarised per loan group.
- Treasury>Loans>Inquiries and reports>Loans per loan group - Current amount report
¶ 34. Monthly finance lease report
The Monthly finance lease report will indicate the average instalment amount and number of instalments remaining
- Treasury>Loans>Inquiries and reports>Monthly finance lease report
¶ 35. Original vs projected report
- Treasury>Loans>Inquiries and reports>Original vs projected
¶ 36. Payment journal error log
- Treasury>Loans>Inquiries and reports>Payment journal error log
¶ 37. Projected interest report
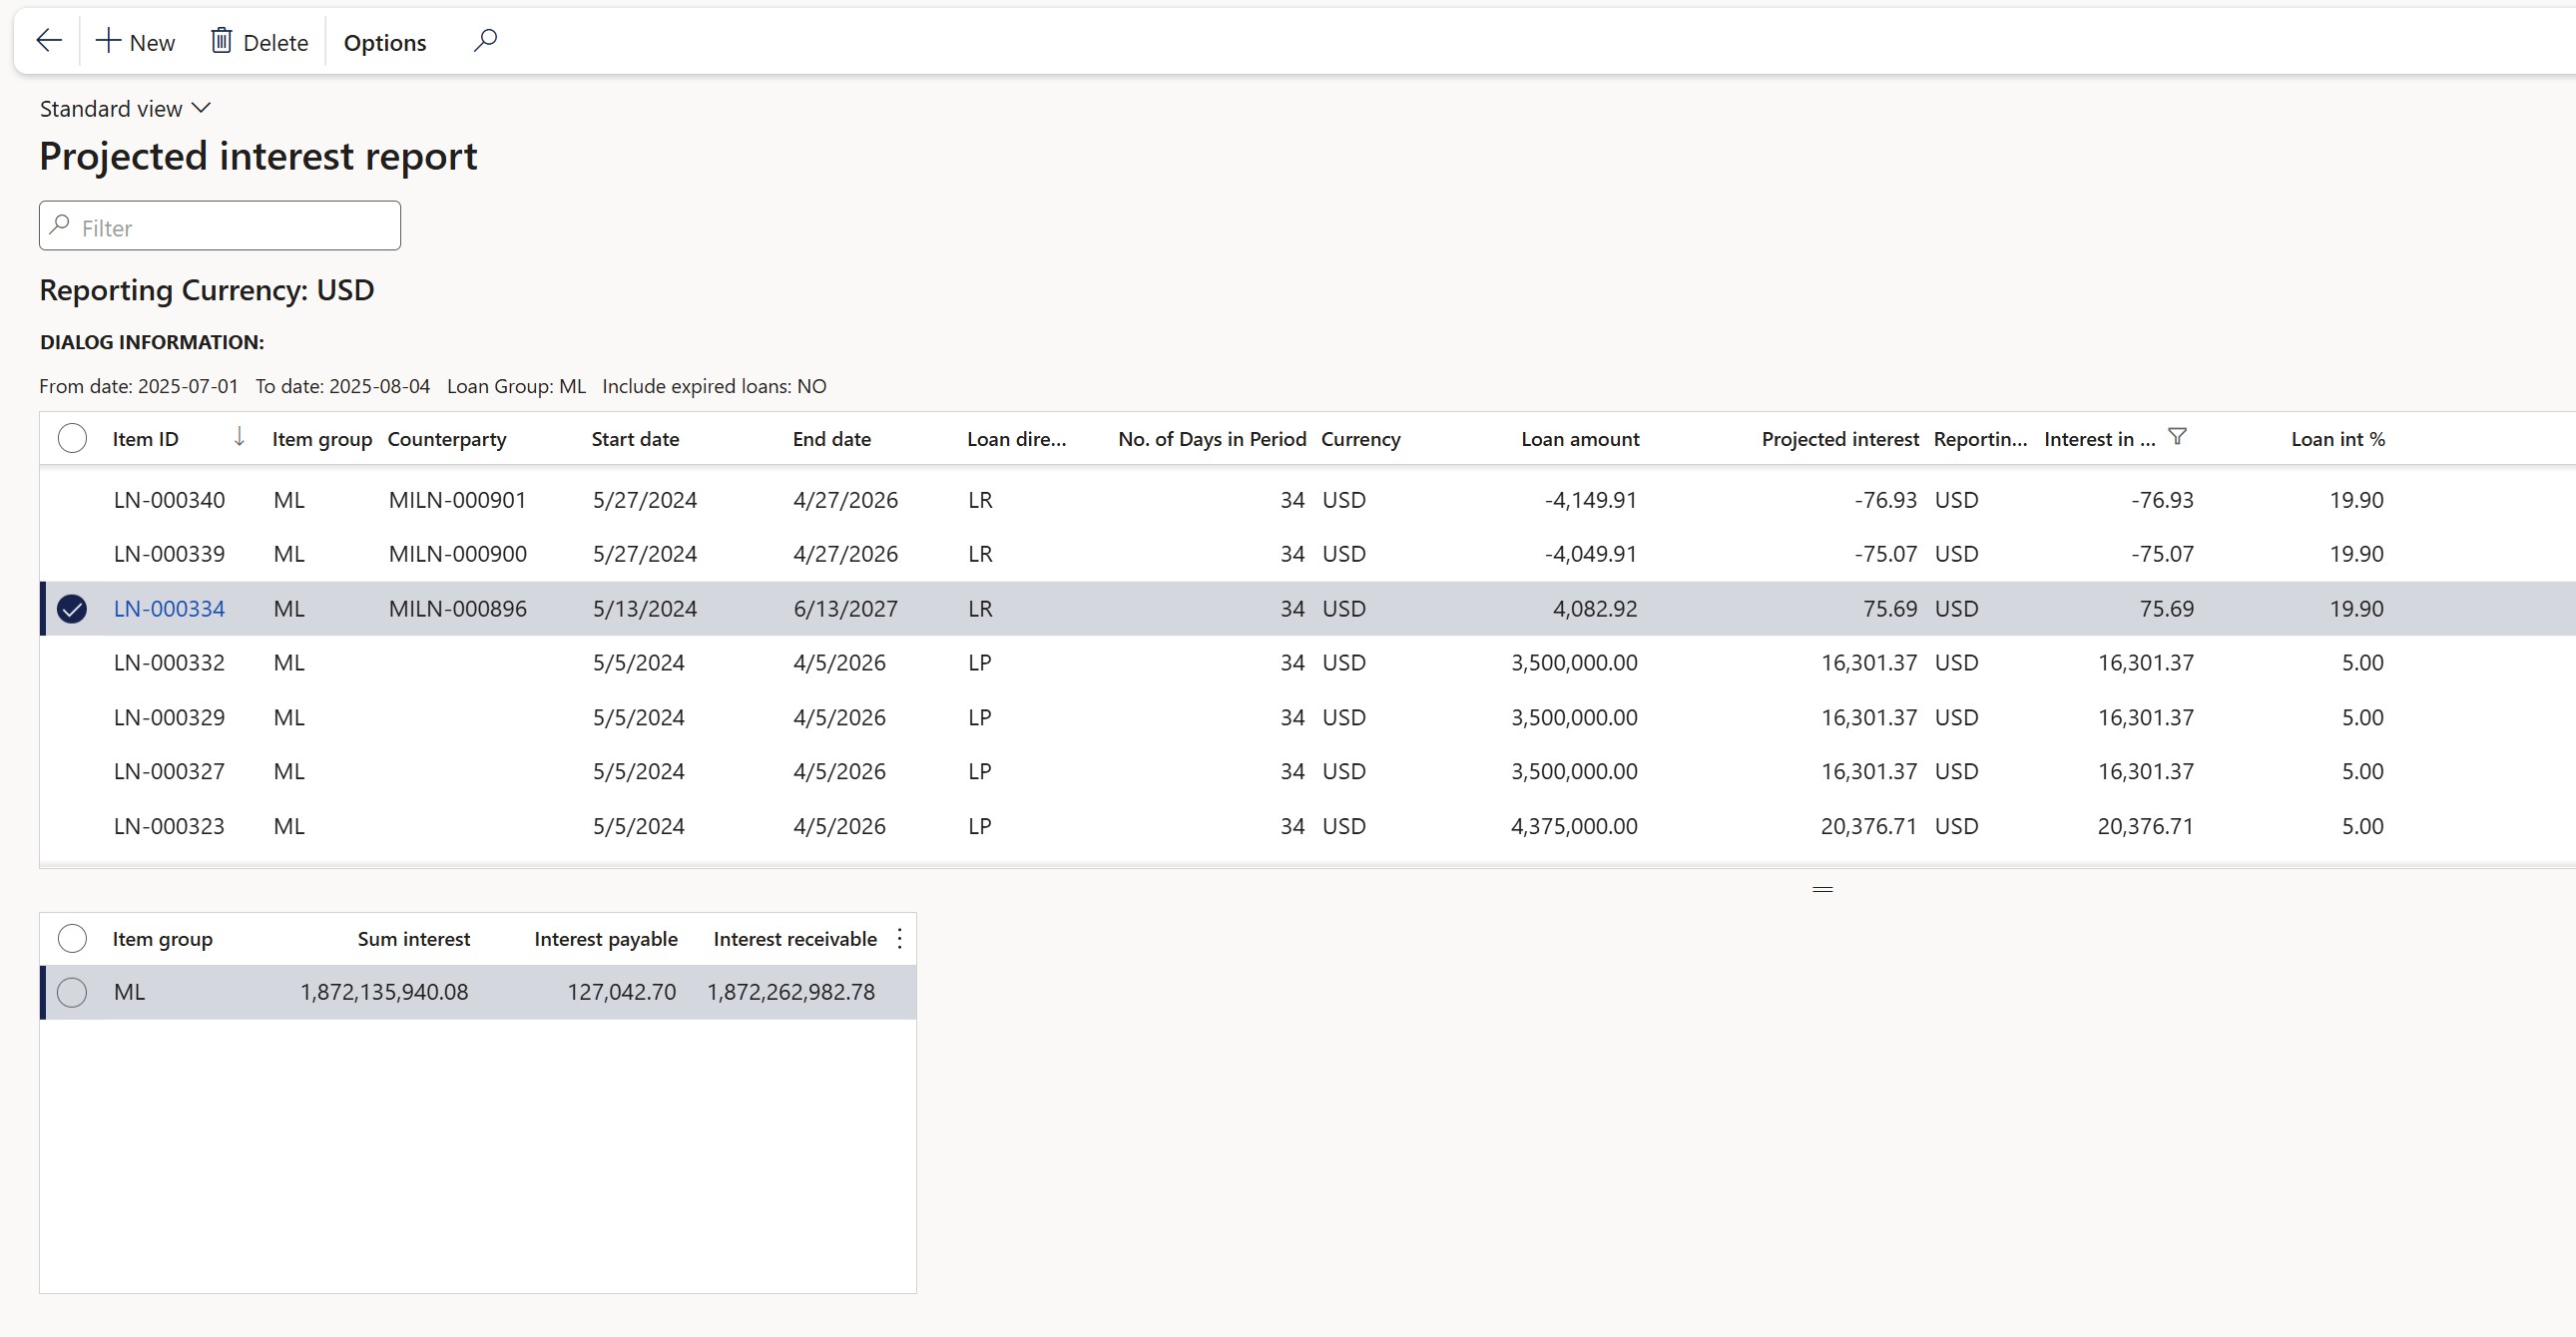
The Projected Interest Report calculates estimated interest for each loan based on a defined reporting period, rather than relying on posted journals. It evaluates the interest payable or receivable by considering the number of days a loan is active within the specified date range, offering a forward-looking view of interest activity. This report is useful for planning and forecasting interest-related cash flows across active and expired loans within a given period.
Report parameters
Navigate to Treasury>Loans>Inquiries and reports>Projected interest report. The report includes the following input fields in its dialog:
- From date – Start of the reporting period
- To date – End of the reporting period
- Loan group – Selectable from a drop-down list
- Include expired loans – Yes/No toggle to include loans that have expired before the reporting period ends
The report output:
The report generates the following columns:
- Item group – Classification of the loan item
- Interest % (Int %) – Interest rate applied
- Interest payable – Projected interest amount to be paid
- Interest receivable – Projected interest amount to be received
¶ 38. Statement of interest for loans
- Treasury>Loans>Inquiries and reports>Statement of interest for loans
¶ 39. Year wise repayment schedule
- Treasury>Loans>Inquiries and reports>Year wise repayment schedule
¶ Investments Inquiries and reports
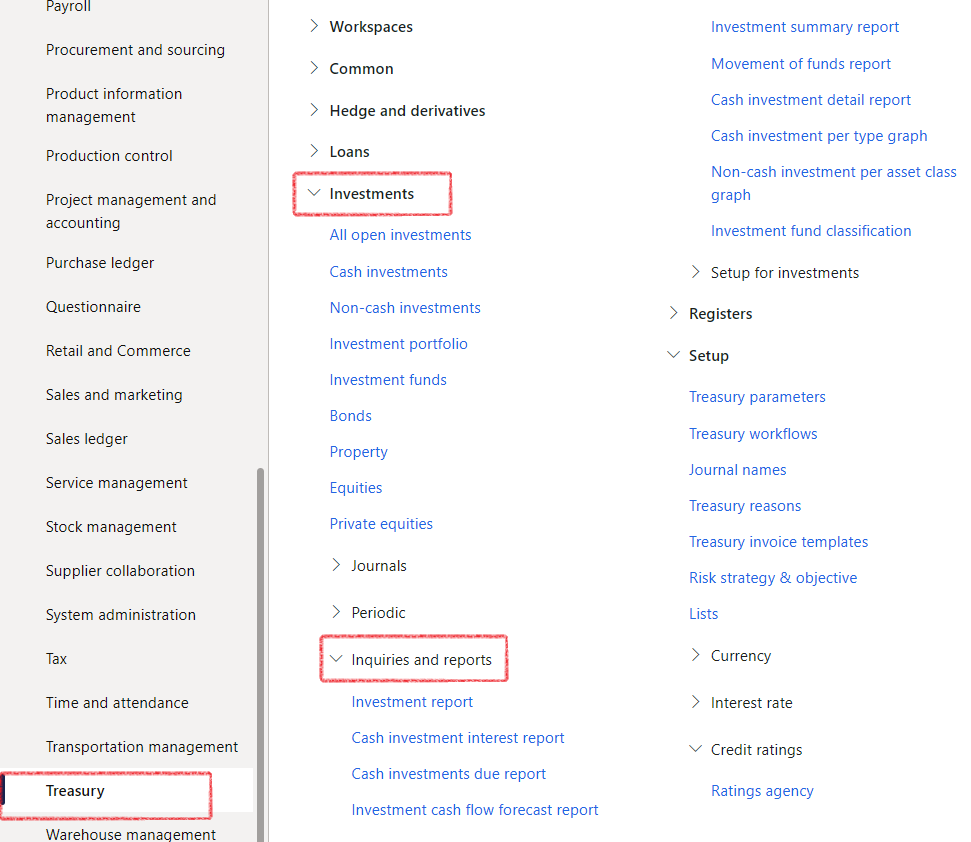
¶ 1. Investment report
Treasury>Investments>Inquiries and reports>Investment report
¶ 2. Cash investment interest report
Treasury>Investments>Inquiries and reports>Cash investment interest report
¶ 3. Cash investments due report
Treasury>Investments>Inquiries and reports>Cash investments due report
¶ 4. Investment cash flow forecast report
Treasury>Investments>Inquiries and reports>Investment cash flow forecast report
¶ 5. Investment summary report
Treasury>Investments>Inquiries and reports>Investment summary report
¶ 6. Movement of funds report
Treasury>Investments>Inquiries and reports>Movement of funds report
¶ 7. Cash investment detail report
Treasury>Investments>Inquiries and reports>Cash investment detail report
¶ 8. Cash investment per type graph
Treasury>Investments>Inquiries and reports>Cash investment per type graph
¶ Registers Inquiries and reports
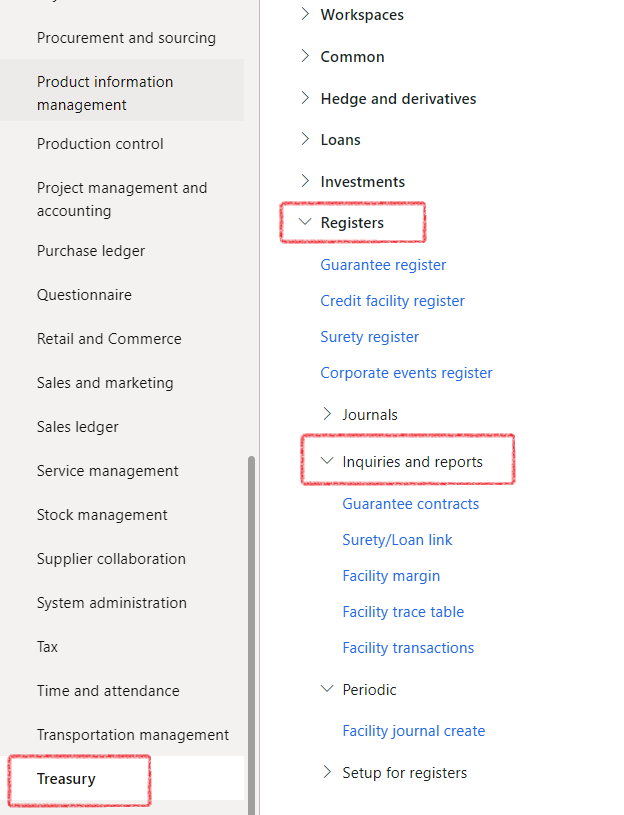
¶ 1. Guarantee contracts
Treasury>Registers>Inquiries and reports>Guarantee contracts
¶ 2. Surety/Loan link
Treasury>Registers>Inquiries and reports>Surety/Loan link
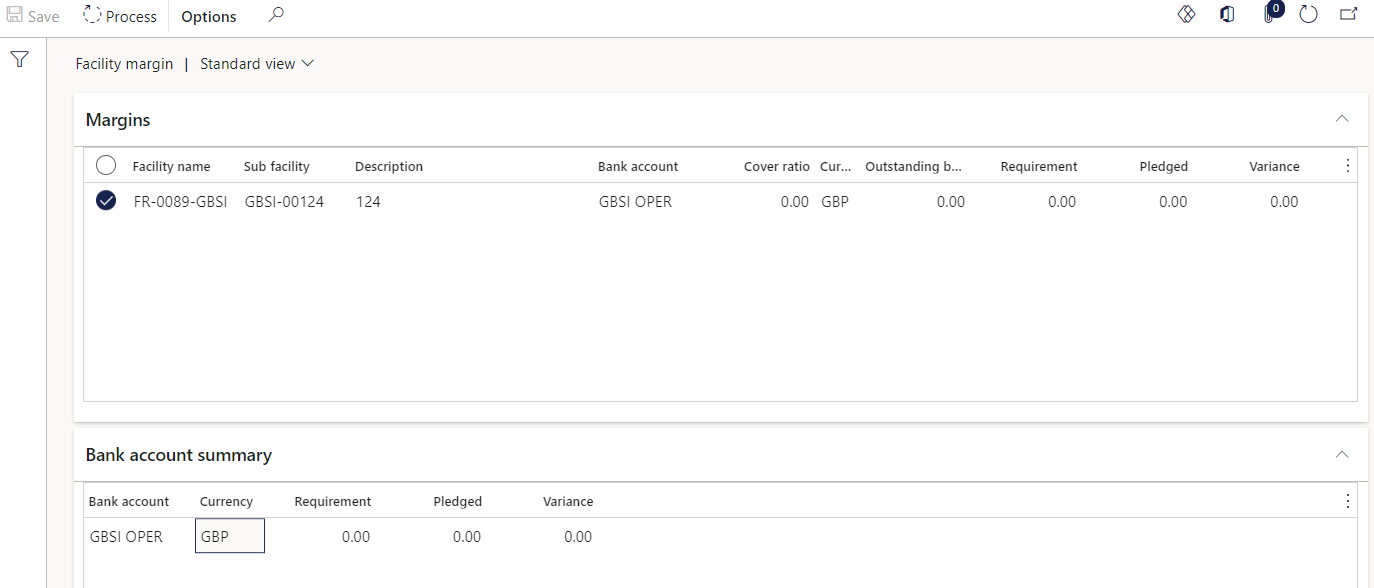
¶ 3. Facility margin
Treasury>Registers>Inquiries and reports>Facility margin
¶ 4. Facility trace table
Treasury>Registers>Inquiries and reports>Facility trace table
¶ 5. Facility transactions
The Facility transactions report will indicate the movement against a facility. The report list all the transactions, with additional information regarding the interest rate. Date range, Facility number and Customer account can be filtered.
- Go to: Treasury > Registers > Inquiries and reports > Facility transactions
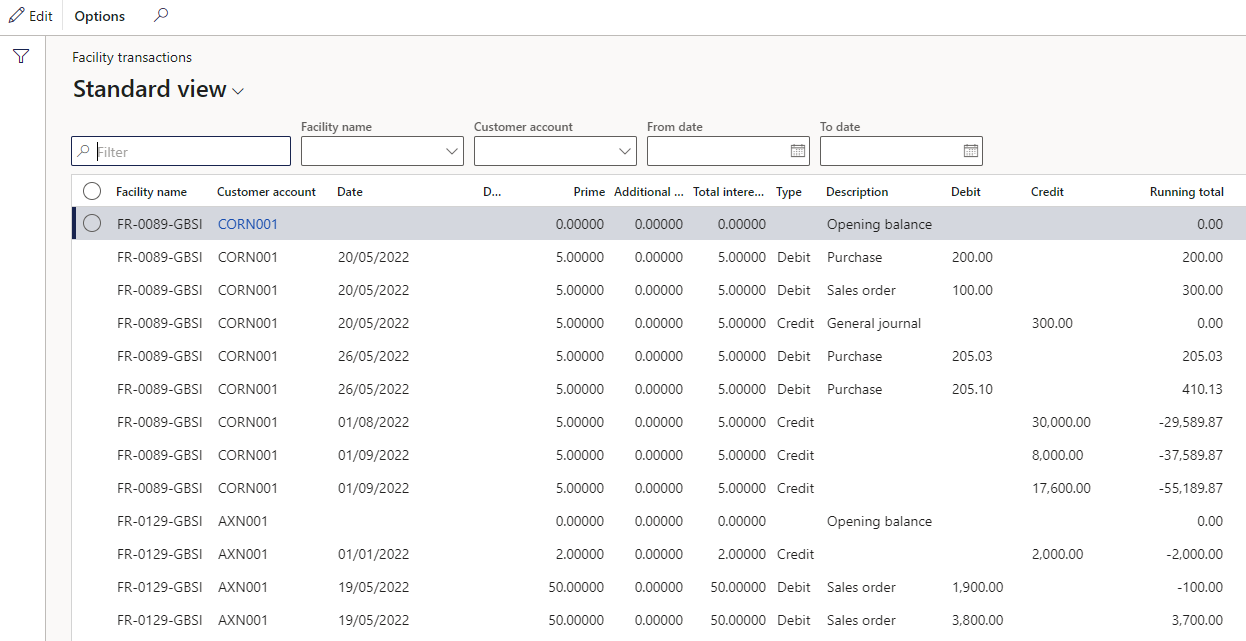
The following filters are available:
- Date range: From and To date
- Facility number: can specify a facility
- Customer: specify a customer
Report columns:
- Facility name
- Customer account
- Date
- Document
- Prime
- Additional interet
- Total interest %
- Type
- Description
- Debit
- Credit
- Running total

¶ Hedge and derivatives Inquiries and reports
¶ 1. Swap deals inquiry
Once an FX Swap contract is terminated, a revaluation will occur to calculate the Gain/Loss on the contract. This revaluation is based on the commitment at the contract termination against the exchange rate value captured in the system, and not the forward rate fixed on the deal.
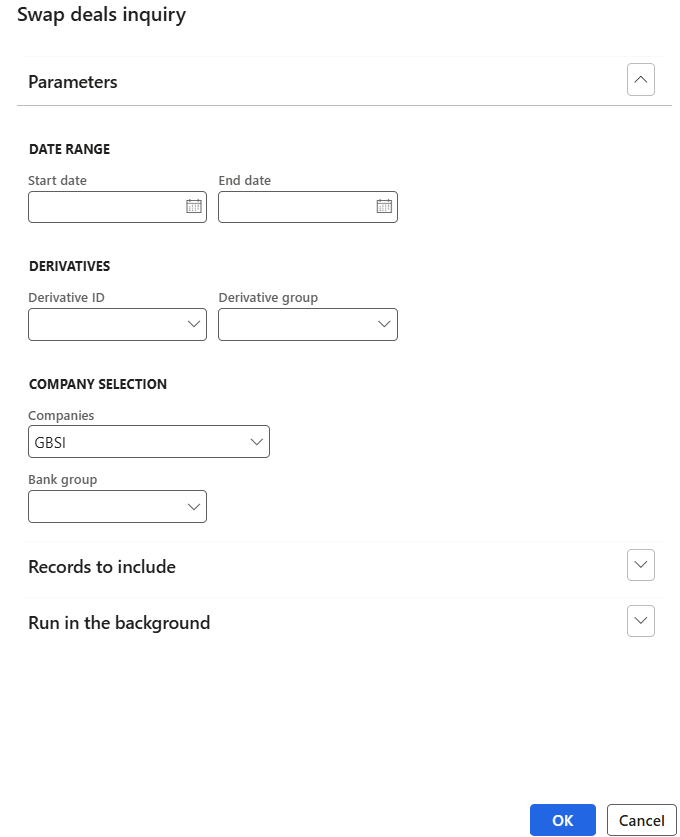
To run the Swap deals inquiry report, go to:
- Treasury > Hedge and derivatives > Enquiries and reports > Swap deals inquiry
- The Start date and End date fields are not mandatory
- This report will calculate and populate after the settlement journal has been posted.
- Trade date - linked to document date
- Bank - this is the bank providing the swap
- Spot rate - conversion rate from currency 1 to currency 2
- Spot value - nominal value of deal in currency 2 on start date
- Forward rate - conversion rate from currency 2 to currency 1
- Accounting rate - conversion rate between currencies as on contract End date

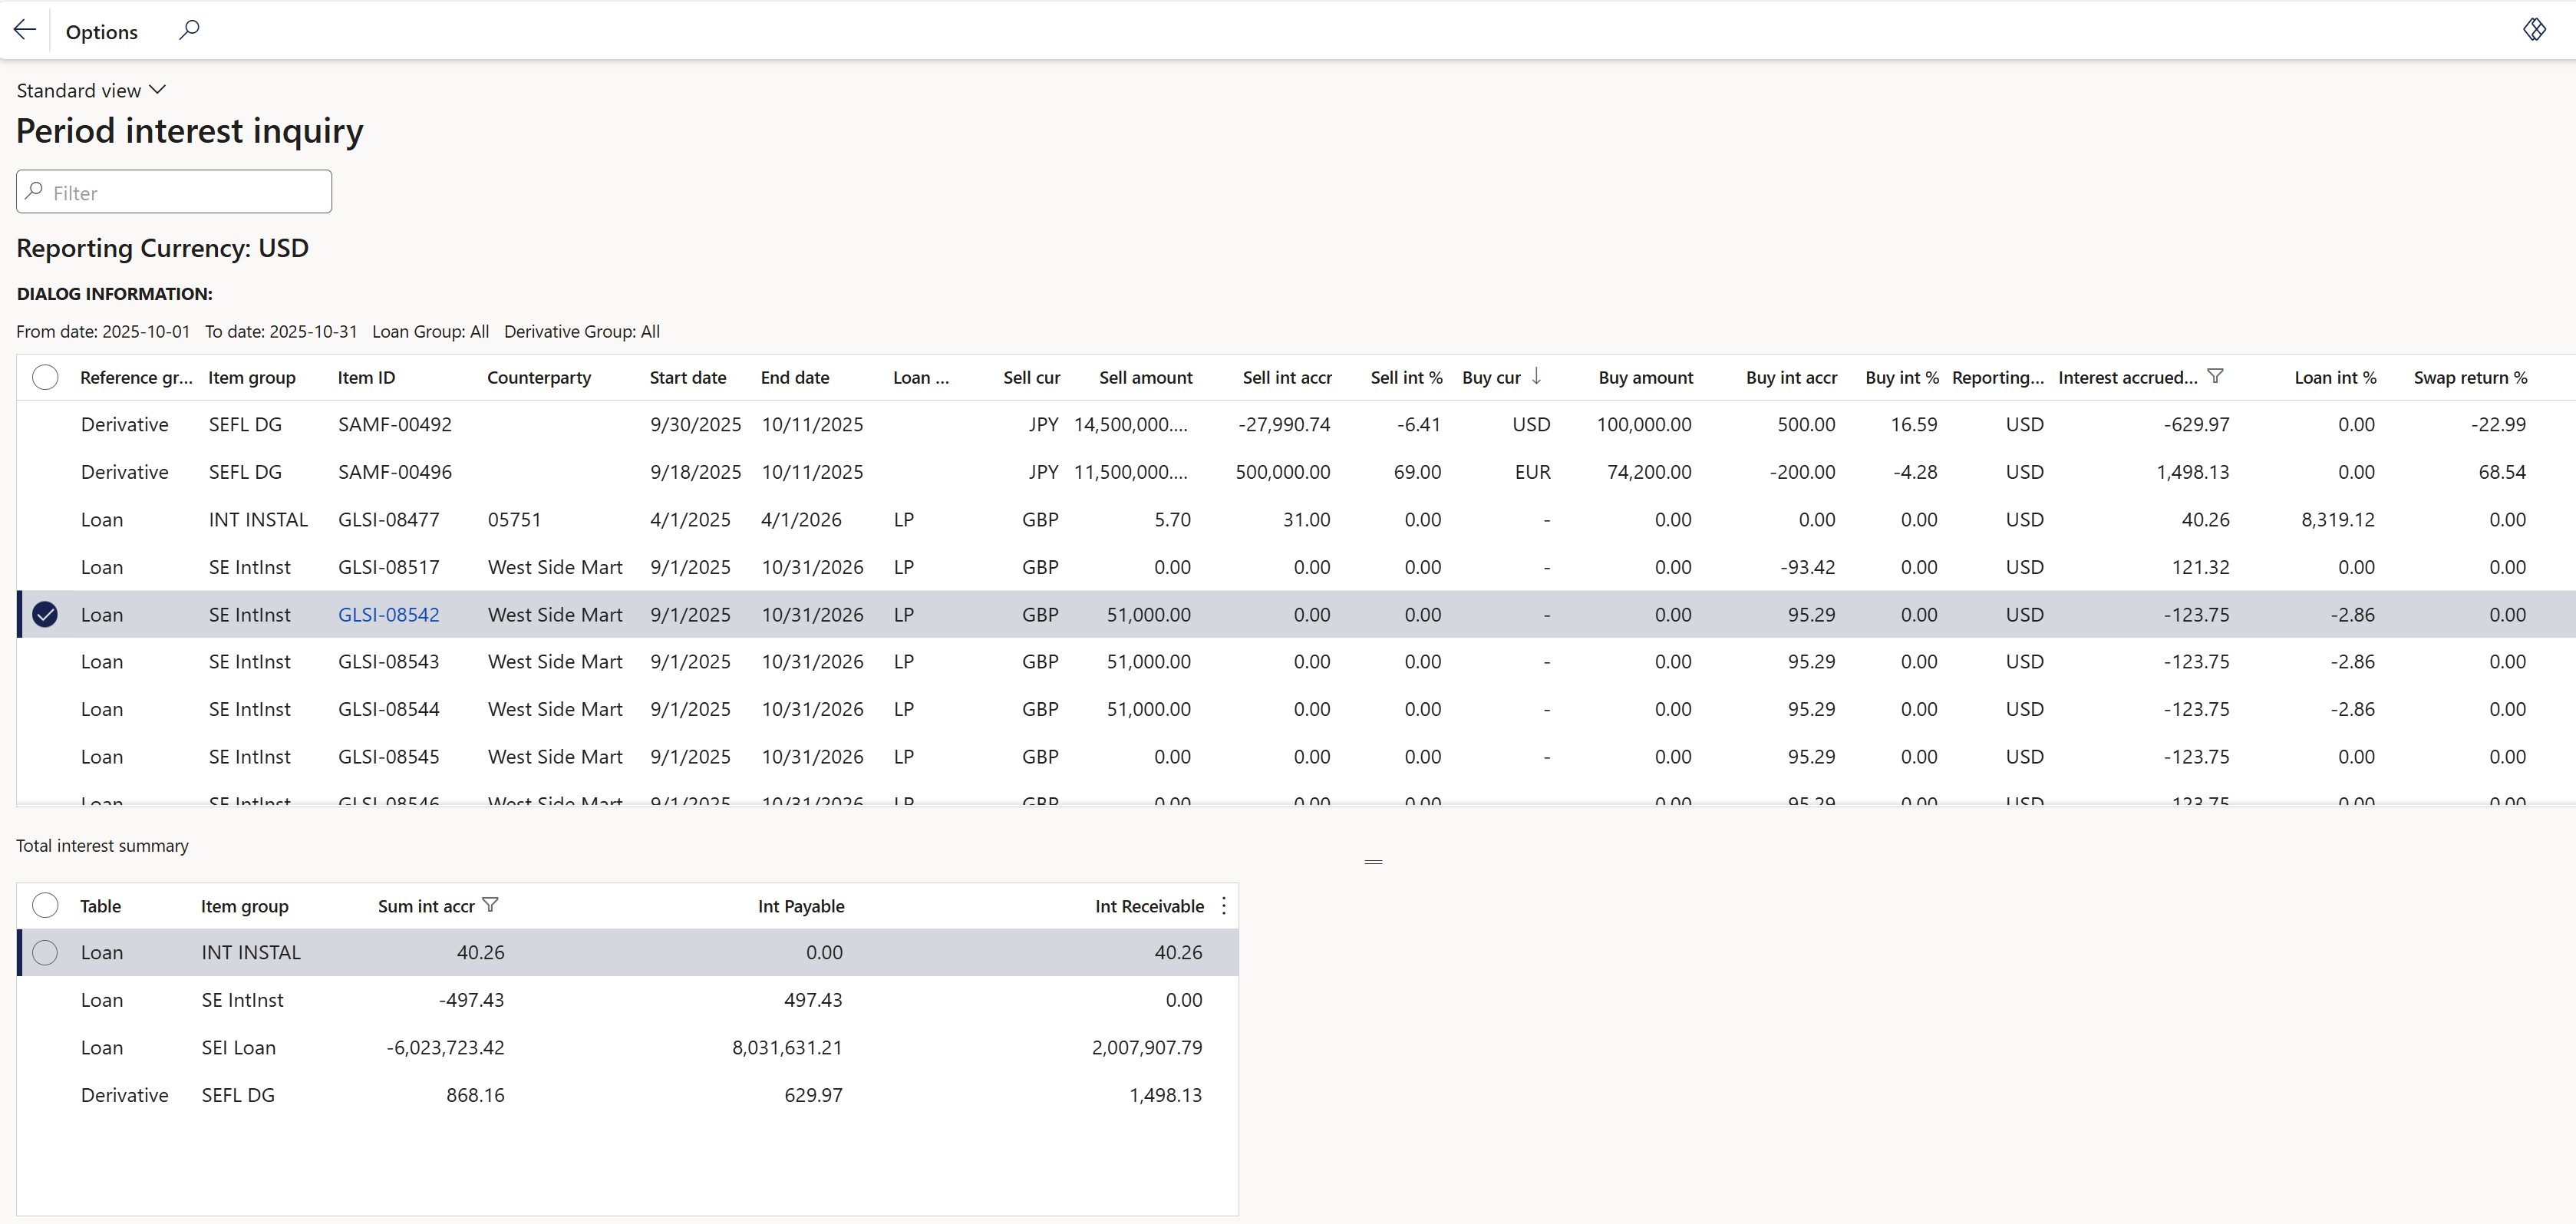
¶ 2. Period interest inquiry
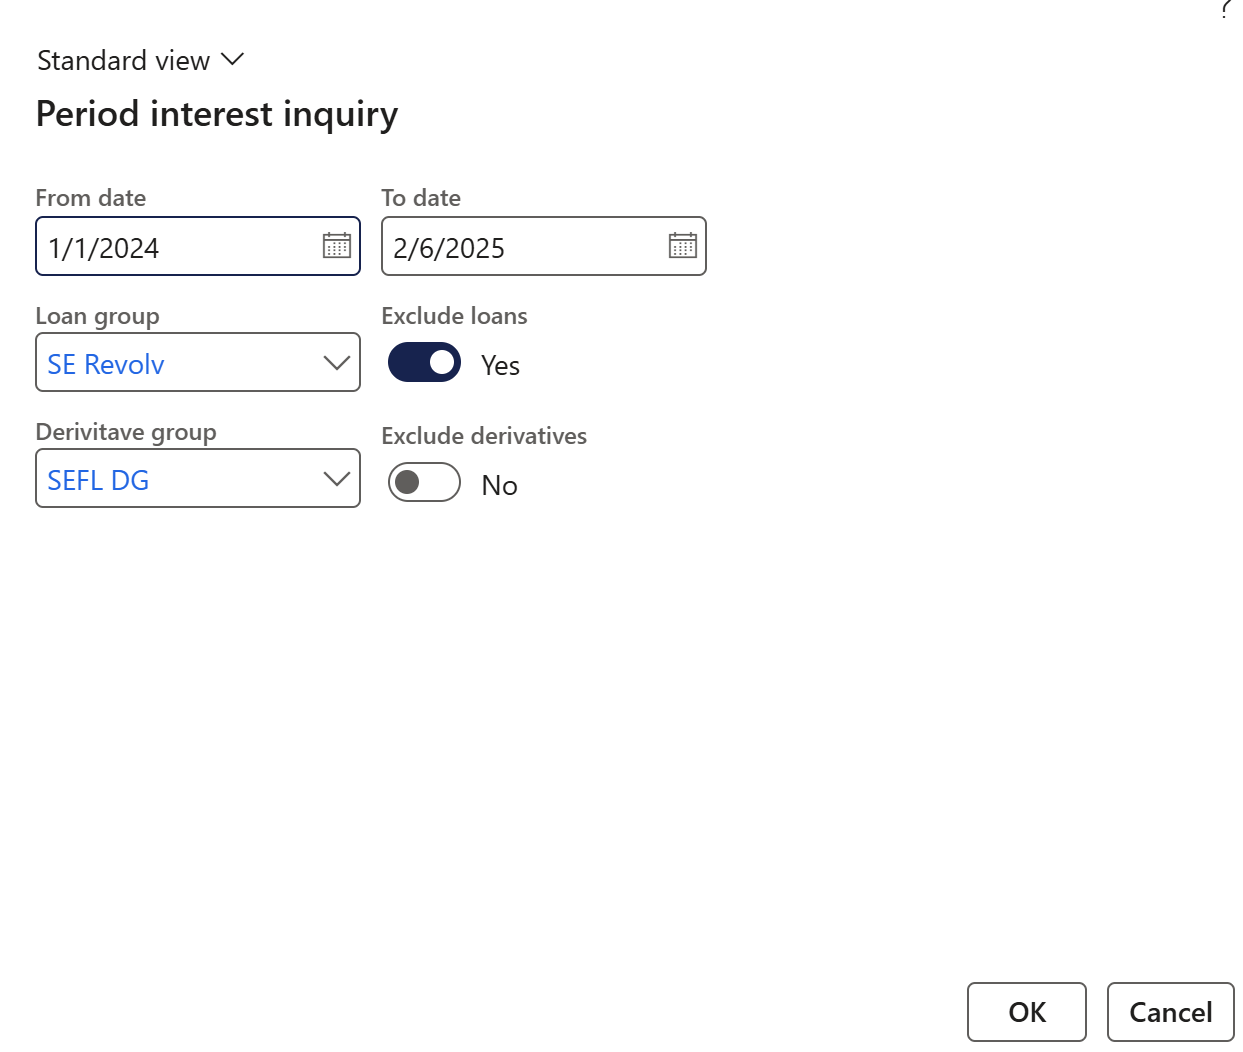
To run the Period interest inquiry report, go to:
- Treasury > Hedge and derivatives > Enquiries and reports > Period interest inquiry
- Select a From date
- Select a To date
All posted interest accruals falling within the specified From and To dates will be included in the report.
An initial recognition journal must be posted first for a derivative in order to qualify for the Period Interest Inquiry.
- Choose a Loan group from the drop-down menu
- Select a Derivative group
- Set the toggle to Yes if you want to Exclude loans from the report
- Set the toggle to Yes if you want to Exclude derivatives from the report, and No to include derivative records
- Click the OK button
The report differentiates between Interest Receivable and Interest Payable when both items are present on a single loan. The loan group reports these items separately.
The inquiry page is divided into two sections:
The Period interest inquiry has the following columns:
- Reference group
- Item group
- Item ID
- Counterparty
- Start date
- End date
- Calendar convention
- The basis on which interest is being calculated
- Calc basis
- Sell cur
- Sell amount
- The average loan amount for all loans for the reporting period for both loans receivable and loans payable loan types.
For derivatives this is the Spot selling amount.
- The average loan amount for all loans for the reporting period for both loans receivable and loans payable loan types.
- Sell interest accrued
- The the receivable interest accrued values for the report period for both loans and derivatives.
No negative values will be shown in the column itself. So: - If it is a loan payable, then the sum of the Debit amount falls under Sell interest accrued. This means for payable loans, the sum of negative accrued values for the requested period.
- If it is a loan receivable, then the sum of the Credit amount falls under Sell interest accrued.
- The the receivable interest accrued values for the report period for both loans and derivatives.
- Sell int %
- The Sell int % column and Buy int % column are able to display negative values for returns on derivative transactions
- Buy cur
- Buy amount
- This is the Spot buying amount for derivatives
- This can also display the average loan amount for a loan direction loans payable for the reporting period.
- Buy interest accrued
- This column displays the payable Interest accrued values during reporting period for loans and derivatives.
No negative values will be displayed in the column itself. - For Derivatives, the Buy int accr column will display per derivative group the summaries of all the calculated accrued interest values of swaps for the period
- For loans: if it is a loan payable, then the sum of Credit amount falls under Buy interest accrued. This means for loan directions loans Payable the sum of positive accrued values for the requested period of report.
- If it is a loan receivable, then the sum of Debit amount falls under Buy interest accrued. This means for loan directions loans Receivable the sum of negative accrued values for the period of the report.
- This column displays the payable Interest accrued values during reporting period for loans and derivatives.
- Buy int %
- The Sell int % column and Buy int % column are able to display negative values for returns on derivative transactions.
- Reporting currency
- Interest accrued in reporting cur
- This is the nett interest values, i.e. Interest Receivable (Sell interest) minus Interest Payable (Buy Interest). In other words, the Sell interest in reporting currency minus Buy interest in reporting currency.
- Int %
- Swap return %
The exchange rate used to convert the Interest Accrued in Reporting Currency field is determined by the From Date selected in the report dialog. For example, if the report is run with a From Date of 1 January 2020, the exchange rate effective on that date will be applied.
Total interest summary columns:
- Table
- Item group
- Sum of interest accrued%
- Int Receivable minus Int Payable will nett to Sum of Interest accrued
- Int Payable
- The Int Payable column displays, per loan and derivative group, the summaries of all the calculated accrued interest values in the Buy Int Accr column for the reporting period and in the reporting currency.
- For Payable loans, all positive interest accruals within the report period on the statement, as displayed on the Buy Int accr column
For Receivable loans, all negative interest accruals during report period on statement, as displayed in the column Buy int acc column
- Int Receivable
- The Int Receivable column displays, per loan and derivative group, the summaries of all the calculated accrued interest values in the Sell Int Accr column for the reporting period.
- These columns will display in Reporting currency
¶ Common Inquiries and reports
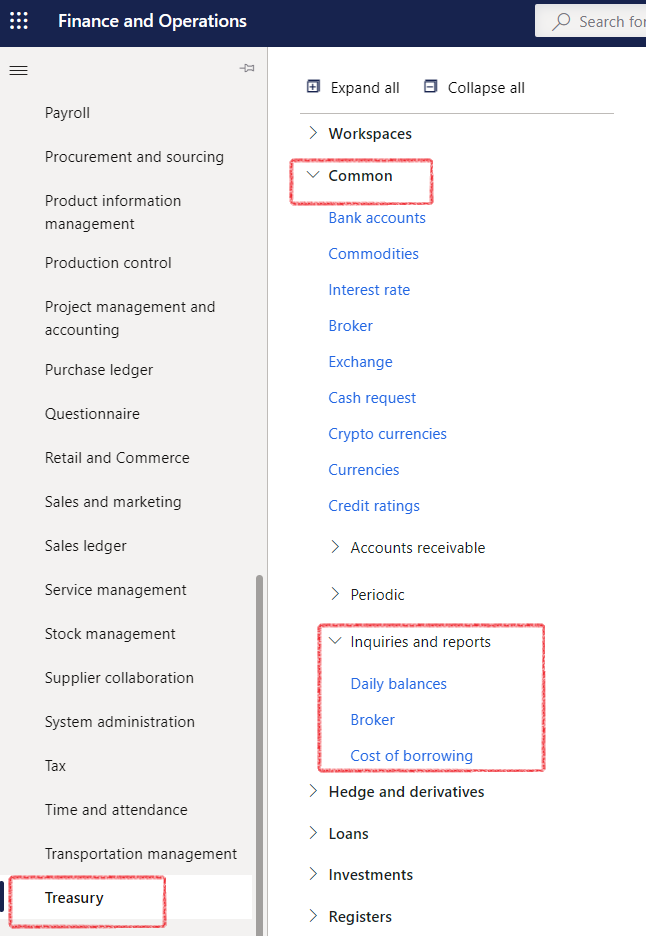
¶ 1. Daily balances
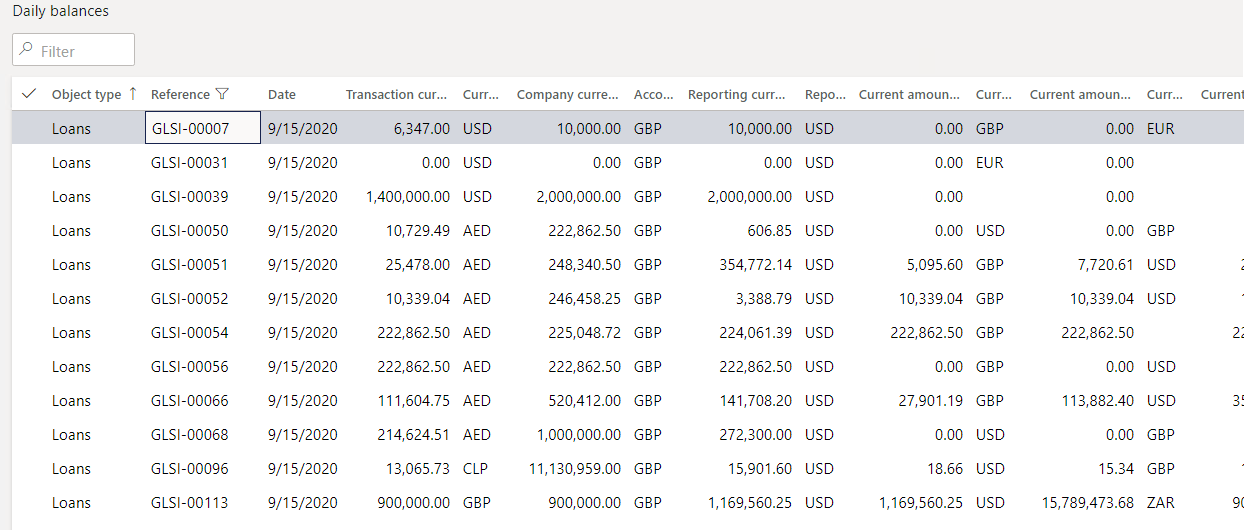
For a quick look at daily balances,
- in the navigation pane, go to: Modules>Treasury>Common>Inquiries and reports>Daily balances
- The Object type will indicate if the balance is a Loan, Cash-, or Non-Cash investment
- The Loan number ID can be seen in the Reference field
- Date indicates the day on which the Daily balance was revised
- Daily balance amounts will be shown in Transaction, Reporting, and Accounting currencies
Transactions in a financial system are typically recorded in a transaction currency, which is the currency in which the transaction took place. The reporting currency is the currency in which financial reports are prepared and presented, and the accounting currency is the currency in which a company's financial statements are kept and recorded.
Having the ability to view the daily balance amounts in all three currencies allows for a comprehensive view of the financial information and helps in effective financial management and analysis. The transaction currency provides a clear picture of the financial activity in the currency it took place, while the reporting and accounting currencies help in presenting the financial information in a manner that is easily understood and comparable across different periods and with other companies
¶ 2. Broker
Treasury>Common>Inquiries and reports>Broker

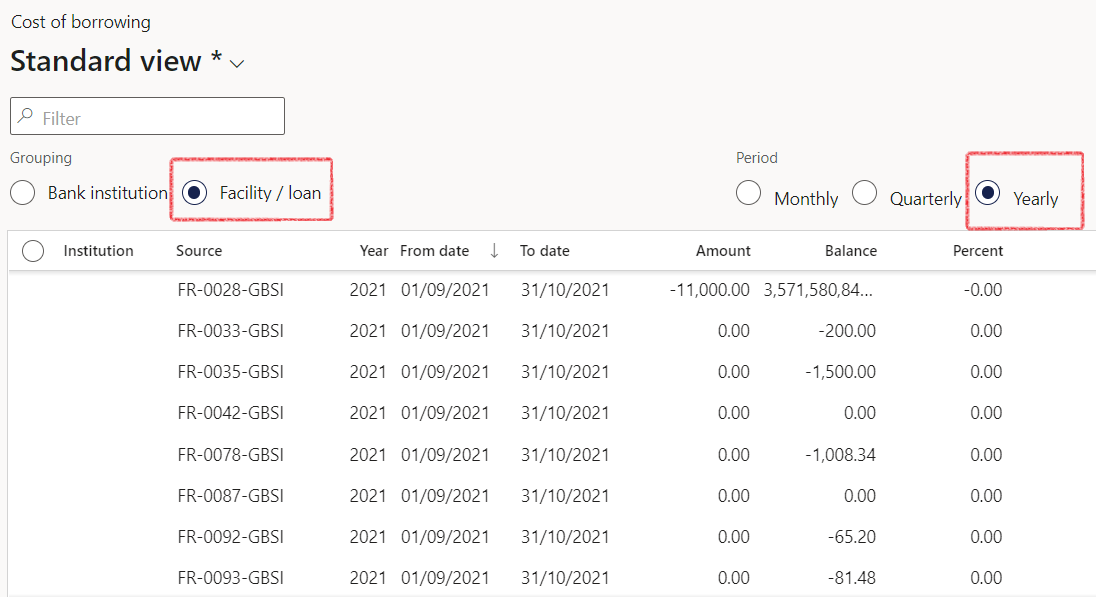
¶ 3. Cost of borrowing
Treasury>Common>Inquiries and reports>Cost of borrowing
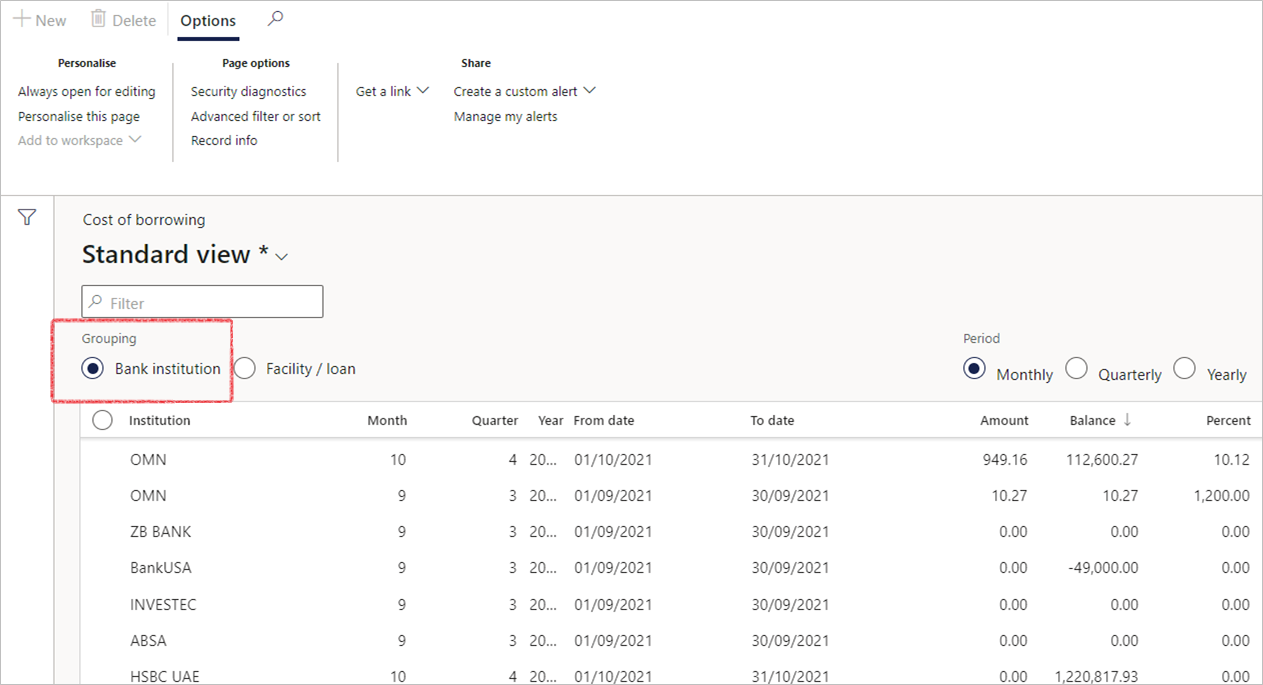
- Choose a grouping between Bank institution, or Facility/Loan
- Select the period by clicking one of the following:
- Monthly
- Quarterly
- Yearly
- This will display a summary per bank institution.
