
¶ Introduction
The D365 LIMS module contains a workspace as well as various reporting and enquiry routines to facilitate efficiency in accessing and reporting analysis results and to promote management of the laboratory processes.
¶ Navigation
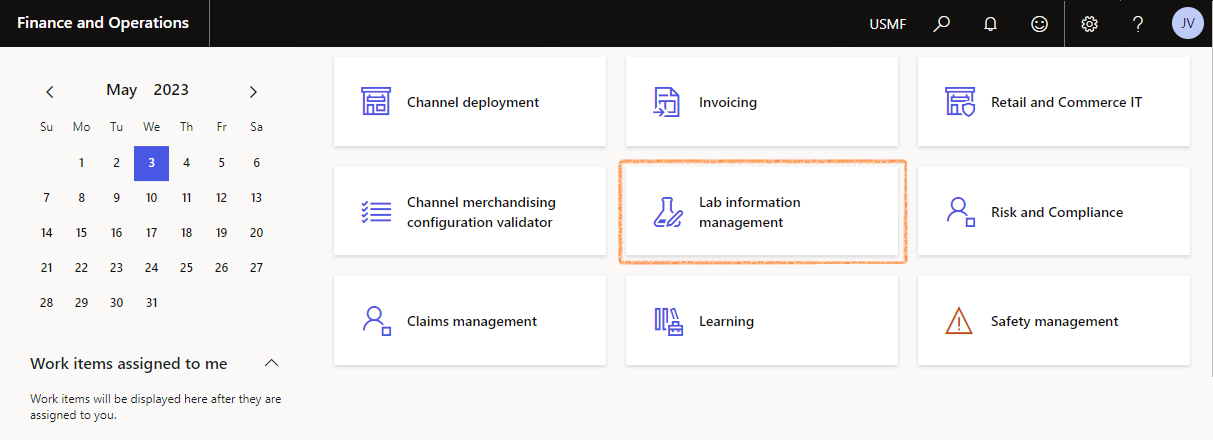
¶ Workspace
The LIMS Workspace is a collection of commonly used links, tiles, lists and jobs that a specific user would perform in their role in the laboratory.
The workspace is a single point of entry into the application and where the user will spend the majority of their time as they complete various tasks, monitor specific reports and manage their day-to-day responsibilities.
¶ My work
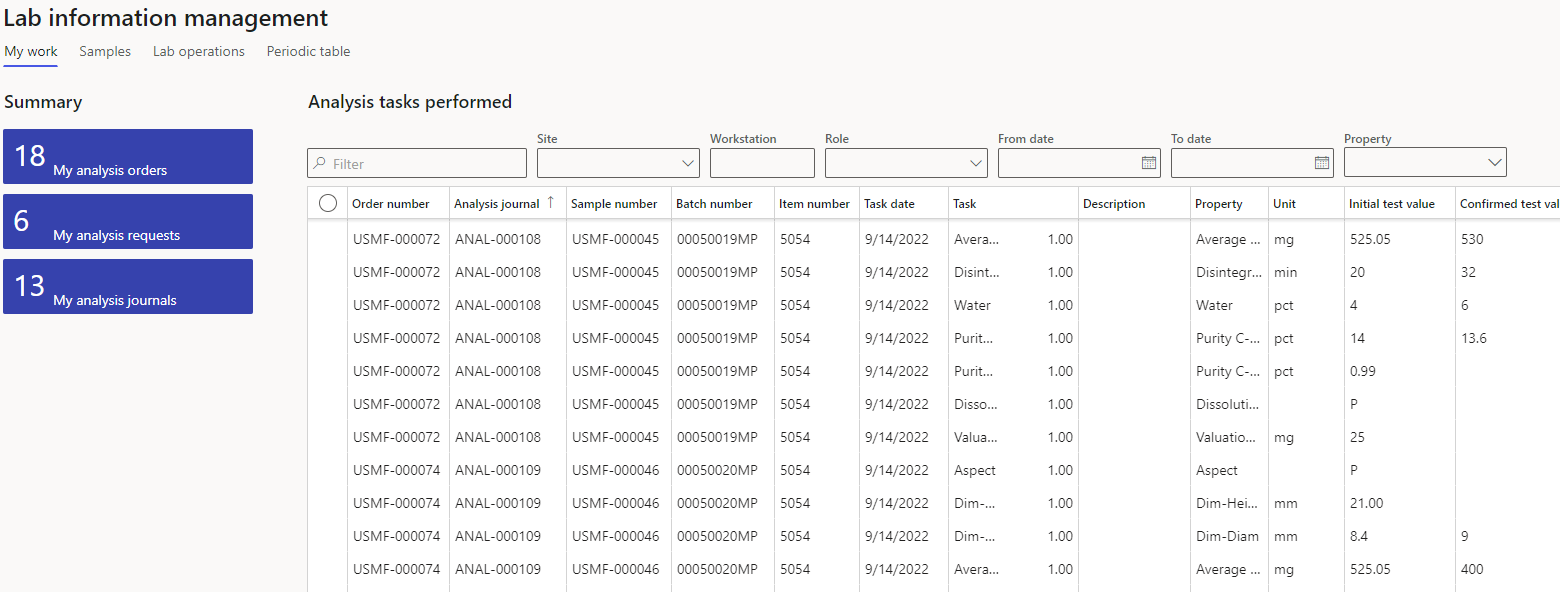
The My work form displays tiles with counters and access to the signed in user's Analysis orders; Analysis requests; Analysis journals as well as an Analysis tasks performed grid.
¶ Summary tiles
Summary tiles provide access to LIMS forms and indicates the number of items for the user. Functions of the Summary tiles:
- My analysis orders
- Displays all Analysis orders created by the user.
- The display may be changed to include orders not created by the user and to included only open or closed Analysis orders.
- Analysis orders may be created and updated from the display.
- My analysis requests
- Displays all Analysis requests created by the user.
- The display may be changed to include requests not created by the user.
- Analysis requests may be created and updated from the display.
- My analysis journals
- Displays all Analysis journals created by the user.
- The display may be changed to include Analysis journals not created by the user.
- Analysis journals may be created and updated from the display.
¶ Analysis tasks performed grid
The grid displays all analysis tasks performed and includes the following data:
| Site | Workstation | Order number | Analysis journal |
| Sample number | Batch number | Sub-batch number | Item number |
| Task date | Line number | Task | Description |
| Property | Unit | Use property | Initial test value |
| Confirmed test value | Property value types | Initial QA value | Confirmed QA value |
| Role | Owner | Date completed | Time completed |
| Calculation status | Property line status | Value status | Enforce limits |
| Interface time stamp | Interface name | Interface variable name | Journal line status |
| Max value | Min value | Calculation status | Numeric type |
| Solve event | Solve rule | Value limit type | Value status |
| Variable name | Variable value | Which value to update |
Click on underlined values to open the source form.
The Analysis tasks performed filters may be utilized to define the analysis tasks displayed in the grid:
- Quick filter
- Site
- Workstation
- Role
- From date
- To date
- Property
¶ Samples
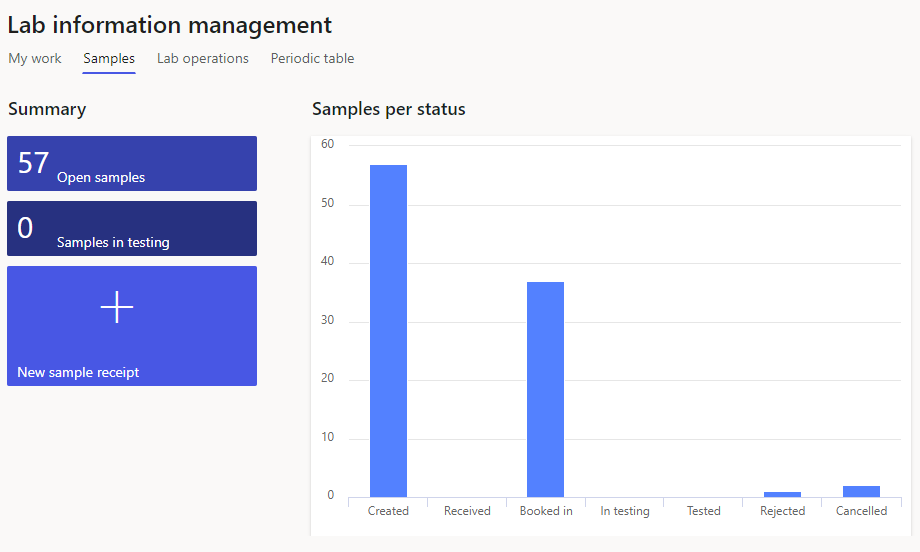
The Summary tiles display counts and provide access to the source forms as well as provide the ability to generate new samples:
- Open samples
- Displays samples with Received or Created status
- Samples in testing
- Displays samples with In testing status
- New sample receipt
- Opens the New Sample dialogue to allow a new sample to be generated
The Samples per status graph provides statistics of samples in various statuses.
¶ Lab operations
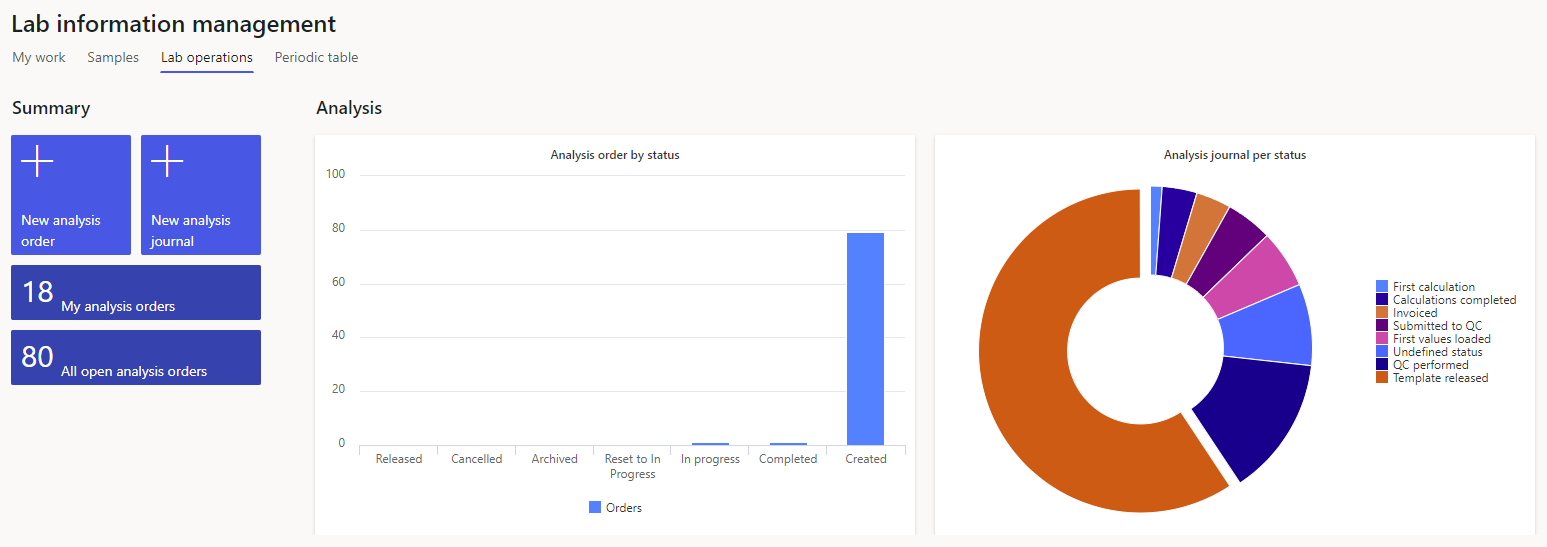
The Lab operations tab includes Summary tiles displaying counts and access to the user's Analysis orders; All open analysis orders as well the ability to generate new analysis orders and journals.
The Analysis graph depicts analysis order by status whilst the Analysis journal chart displays the journals per status.
¶ Summary tiles
The Summary tiles display counts and provide access to the source forms as well as the ability to generate new Analysis orders and journals:
- New analysis order
- Opens the New analysis order dialogue to allow a new order to be generated
- New analysis journal
- Opens the New analysis journal dialogue to allow a new journal to be generated
- My analysis orders
- Displays a count of the user's analysis orders
- Click on the tile to access the Analysis orders form, which has been filtered to only display Analysis orders for the user. The display may however be changed to view all analysis orders.
- All open analysis orders
- Displays a count of all open analysis orders
- Click on the tile to access the Analysis orders form, which has been filtered to display all open Analysis orders. The display may however be changed to view all analysis orders.
¶ Periodic table
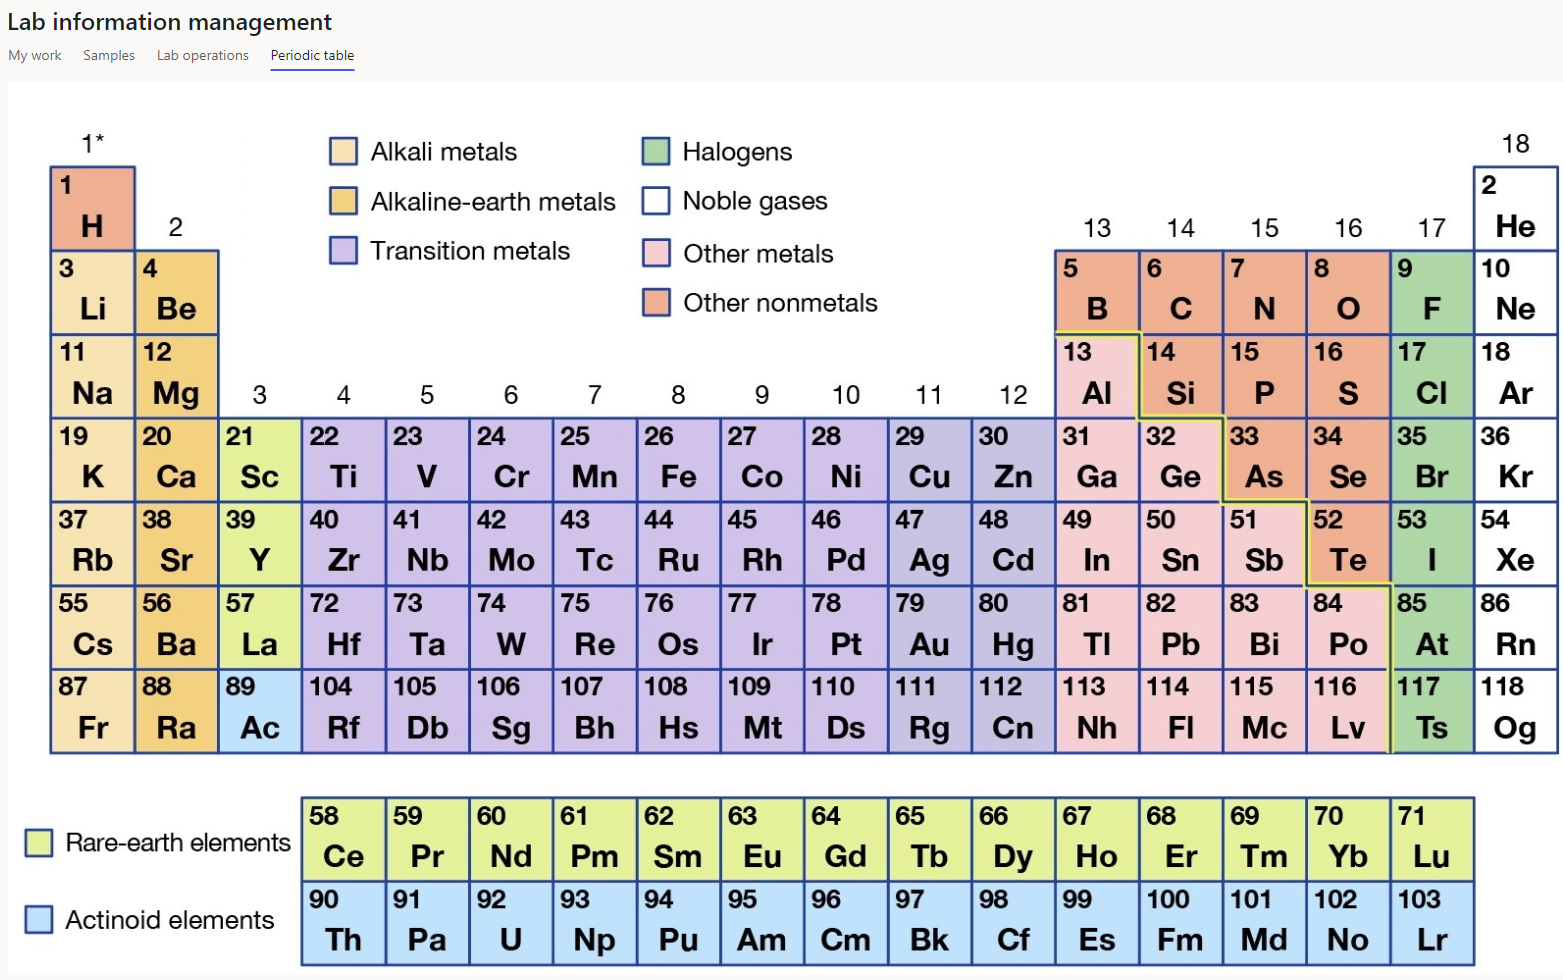
The Periodic table tab displays an image depicting the periodic table.
¶ Enquiries
Various enquiry options are available in the LIMS module to assist with management of laboratory processes as explained below.
¶ Sample test results
Once Analysis journal(s) have been linked to a sample, the results of the journals may be access from the Samples form:
- Go to: Lab information management > Common > Samples
- Select the relevant sample in the grid
- Click on Results in the action pane
Note that the Results button will only become available for selection once the Sample has been linked to an Analysis journal.

The tasks included in all Analysis journals linked to the sample will be displayed with any results that may have been entered:
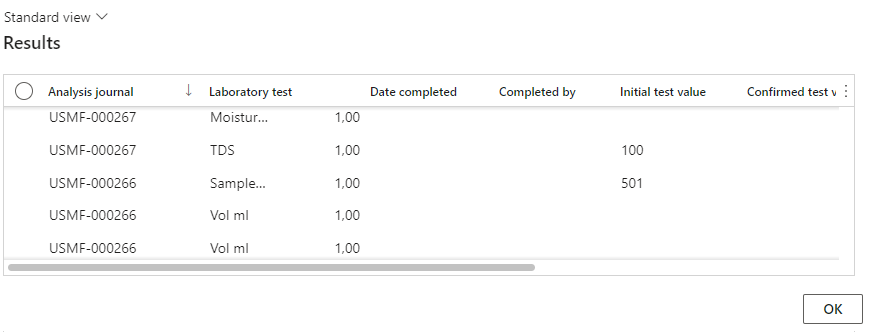
- Click on the OK button to exit the Results form.
¶ Analysis tasks performed
The Analysis tasks performed form provides and centralized view of all Analysis journal lines and results which may be filtered and exported as needed.
The grid may be accessed via the LIMS workspace as well as via the Laboratory information management module menu.
- Go to: Lab information management > Enquiries > Analysis tasks performed
- Utilize any of the available filters as needed:
- Quick filter
- Site
- Workstation
- Role
- From date
- To date
- Property
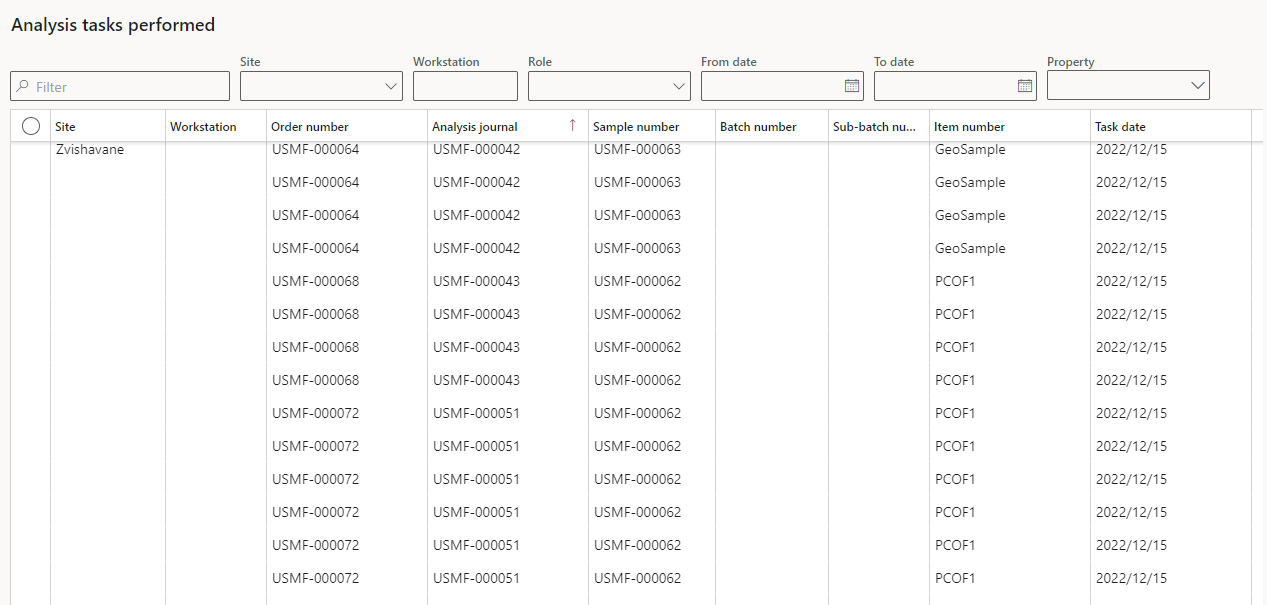
The grid includes the following information:
| Site | Workstation | Order number | Analysis journal |
| Sample number | Batch number | Sub-batch number | Item number |
| Task date | Line number | Task | Description |
| Property | Unit | Use property | Initial test value |
| Confirmed test value | Property value types | Initial QA value | Confirmed QA value |
| Role | Owner | Date completed | Time completed |
| Calculation status | Property line status | Value status | Enforce limits |
| Interface time stamp | Interface name | Interface variable name | Journal line status |
| Max value | Min value | Calculation status | Numeric type |
| Solve event | Solve rule | Value limit type | Value status |
| Variable name | Variable value | Which value to update |
- Click on underlined values to open the source form.
- To export the data displayed in the grid, click on the Open in Microsoft Office button in the action pane then select to open or export the data in Excel:

The export may be downloaded; saved to OneDrive or SharePoint. Example of exported sheet:

¶ Reports
To generate a Certificate of analysis report, access the analysis journal:
- Go to: Lab information management > Common > Analysis journal
- Select the relevant analysis journal in the grid
- Select Journal in the Action pane
- Select Certificate of Analysis in the Print button group

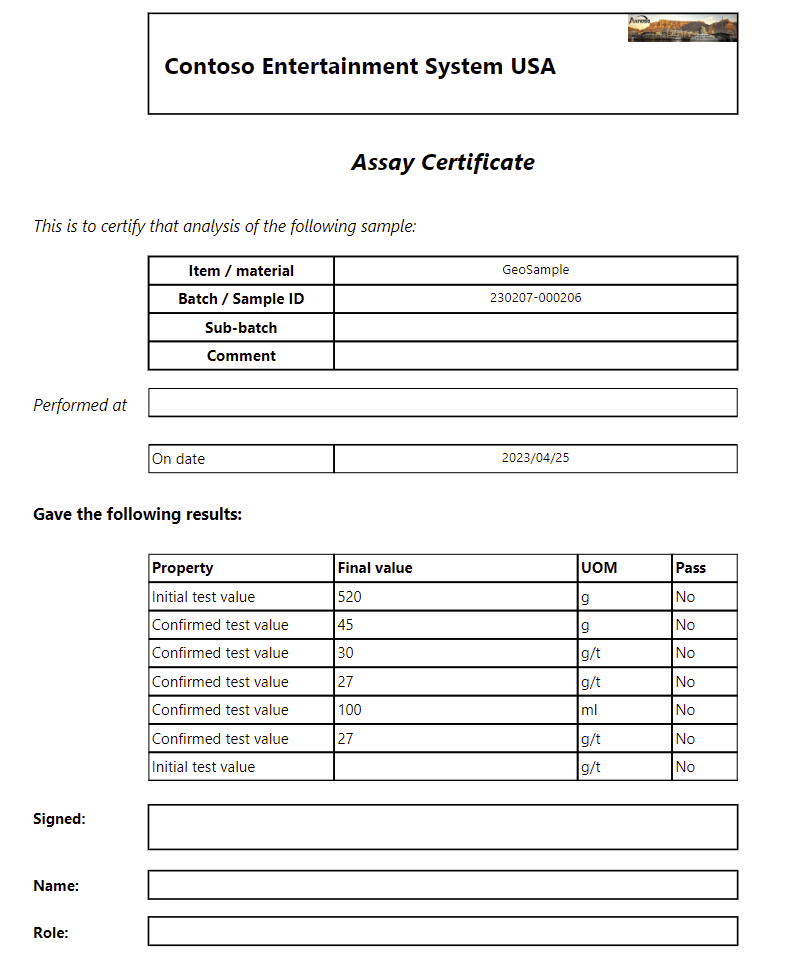
The Certificate of analysis can be exported; downloaded or printed if needed.