
¶ Introduction
Traditional Enterprise Resource Planning (ERP) solutions are not good at tracking most factors inherent in doing business that impact others, nor do they provide a model for describing the processes involved in being operationally sustainable.
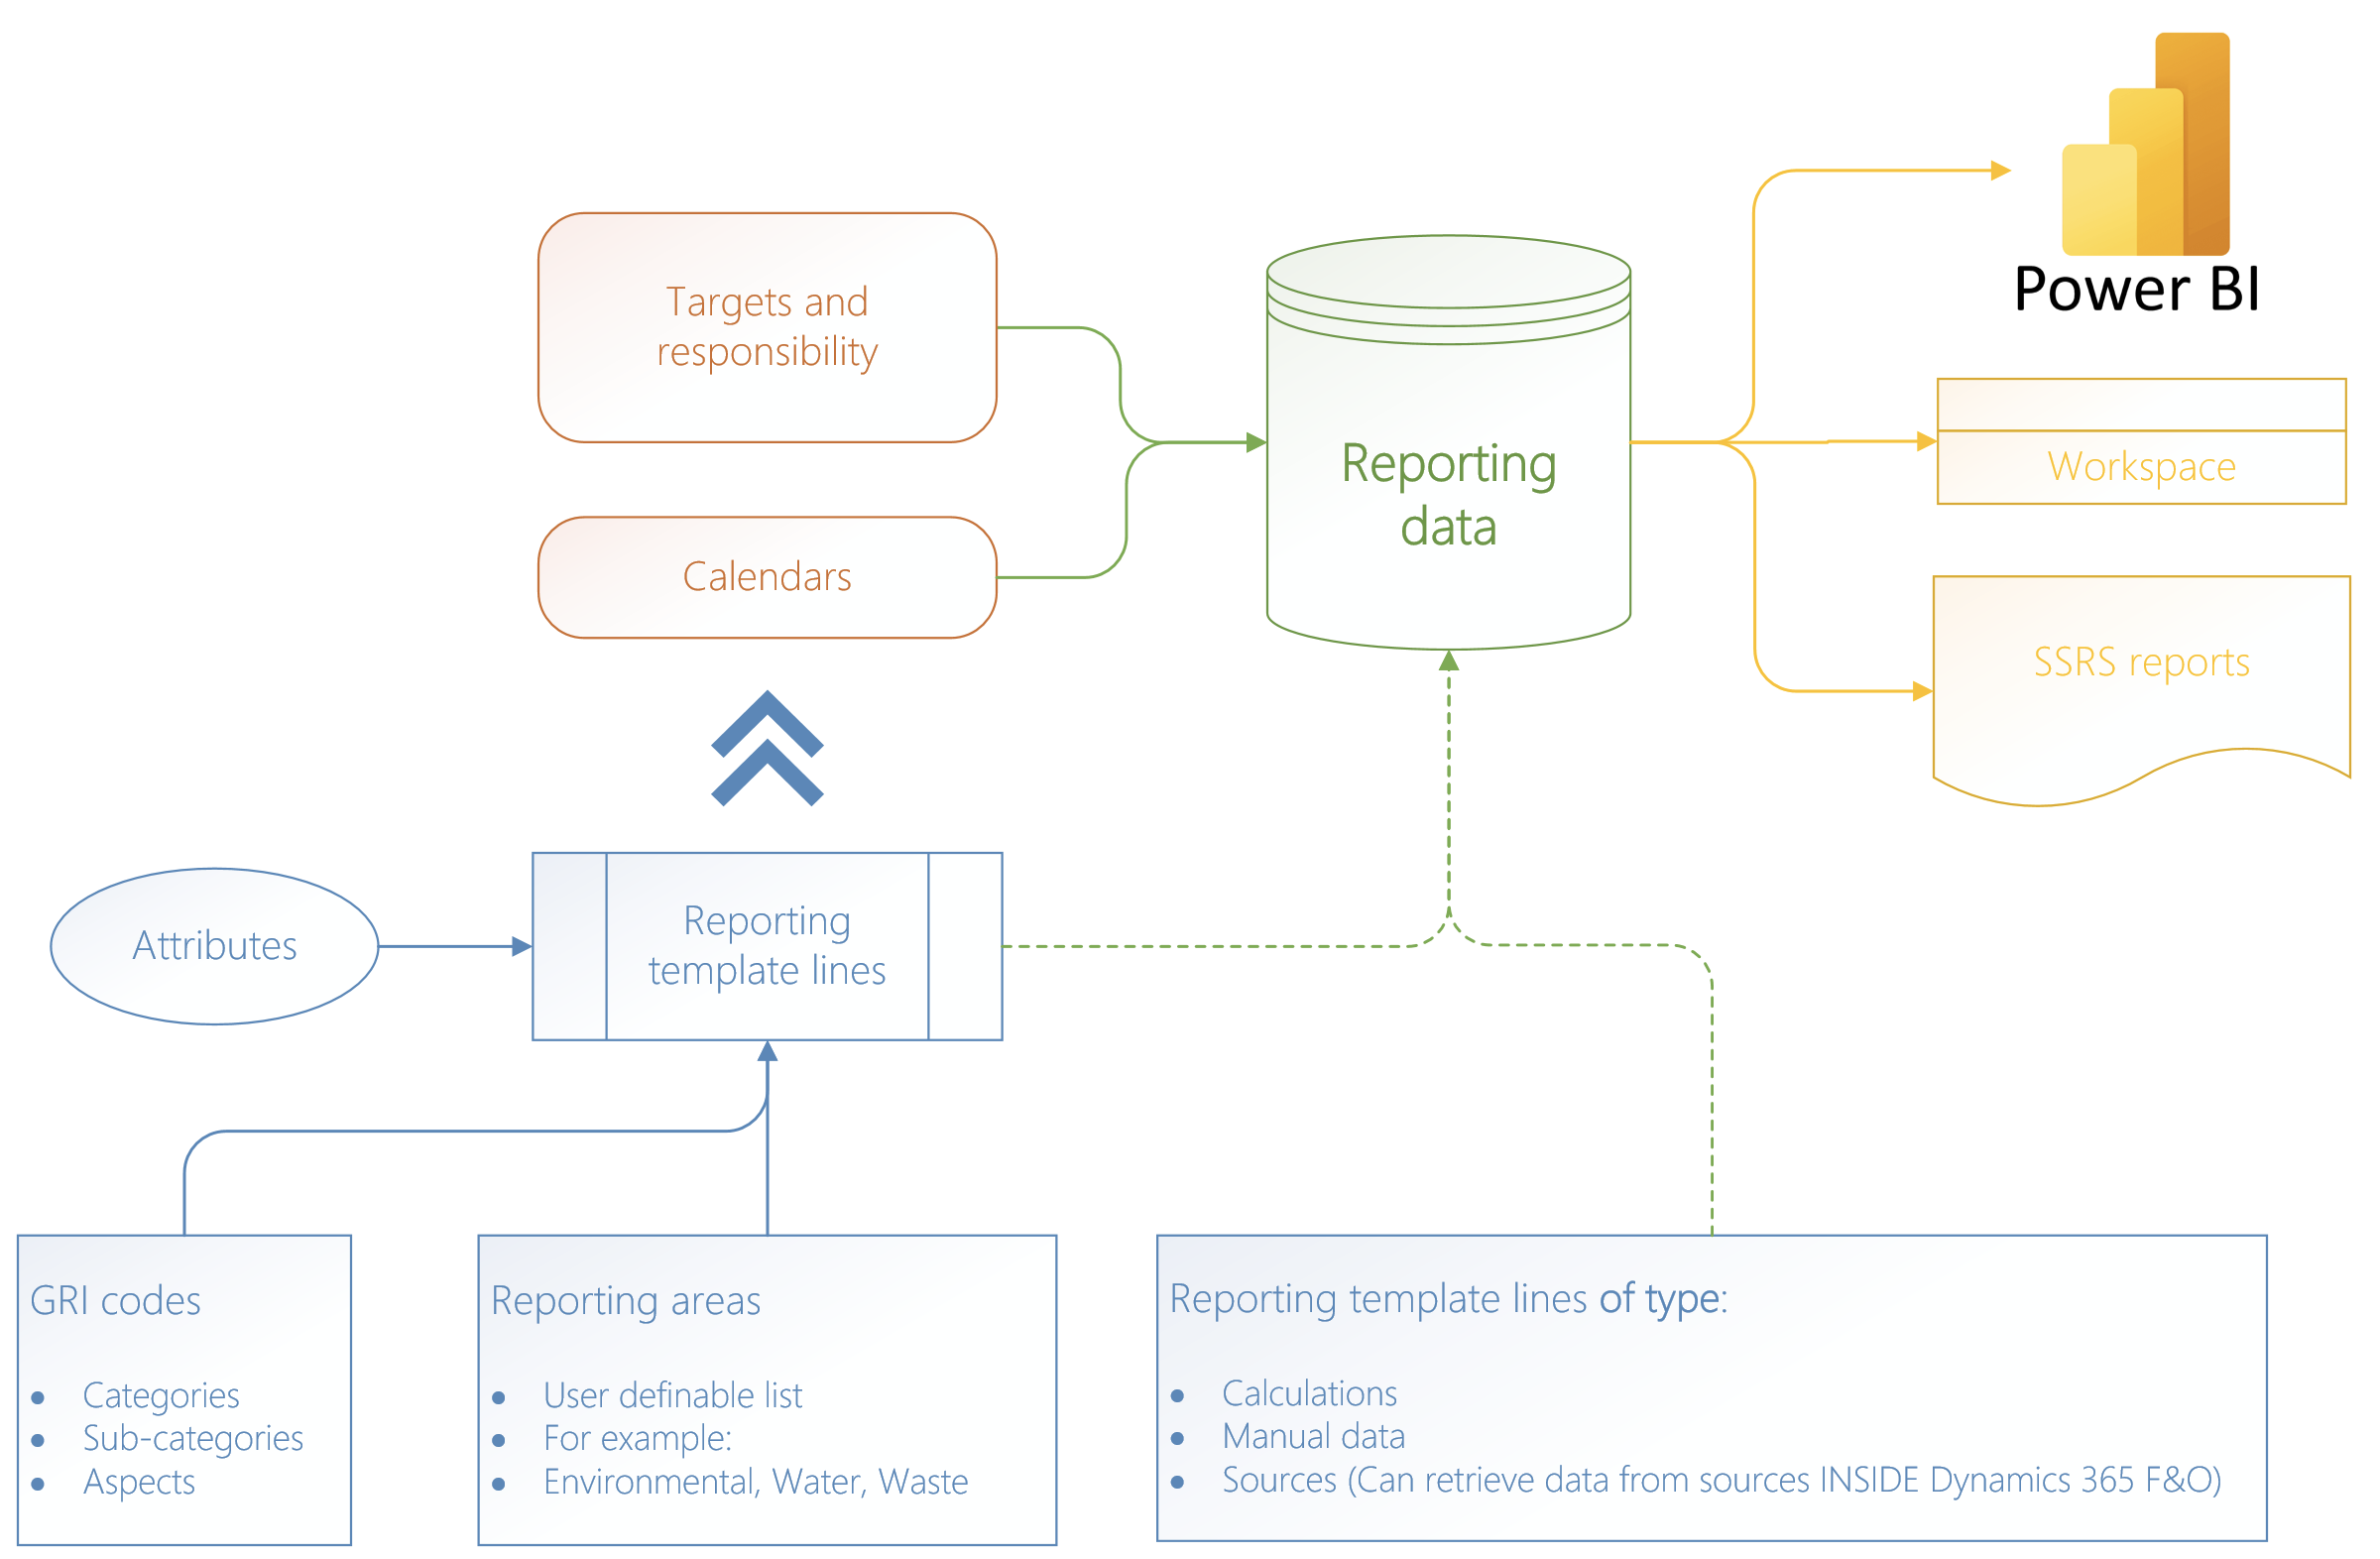
The purpose of this module is to create a repository where the users can do non-financial report (NFR) and sustainable reporting (SR). This is done by entering monthly (or daily) data for above purposes. Calculations are automated and source data from other corners inside Dynamics 365 F&O are used.
Operational and sustainability reporting (OSR) inside Dynamics GRC 365 helps enterprises to model the flows of utilities, waste & energy throughout its internal structure and its external relationships. This not only improve decision making but provide a compelling platform to be transparent and grow a sustainable enterprise.
A reporting template is created to accomplish above. In this template, users specify the Data descriptors for the data that must be collected. The Department where the data must be collected from, the sources inside D365 and manual data entry is also supported. Each user will enter the required data for their area of responsibility. OSR use the fiscal calendar that is setup under the General Ledger, to align with the company’s financial reporting year.
Finally, using reporting and analytics, users can explore how changes to the enterprise processes and practices might change sustainability and impact.
¶ Navigation
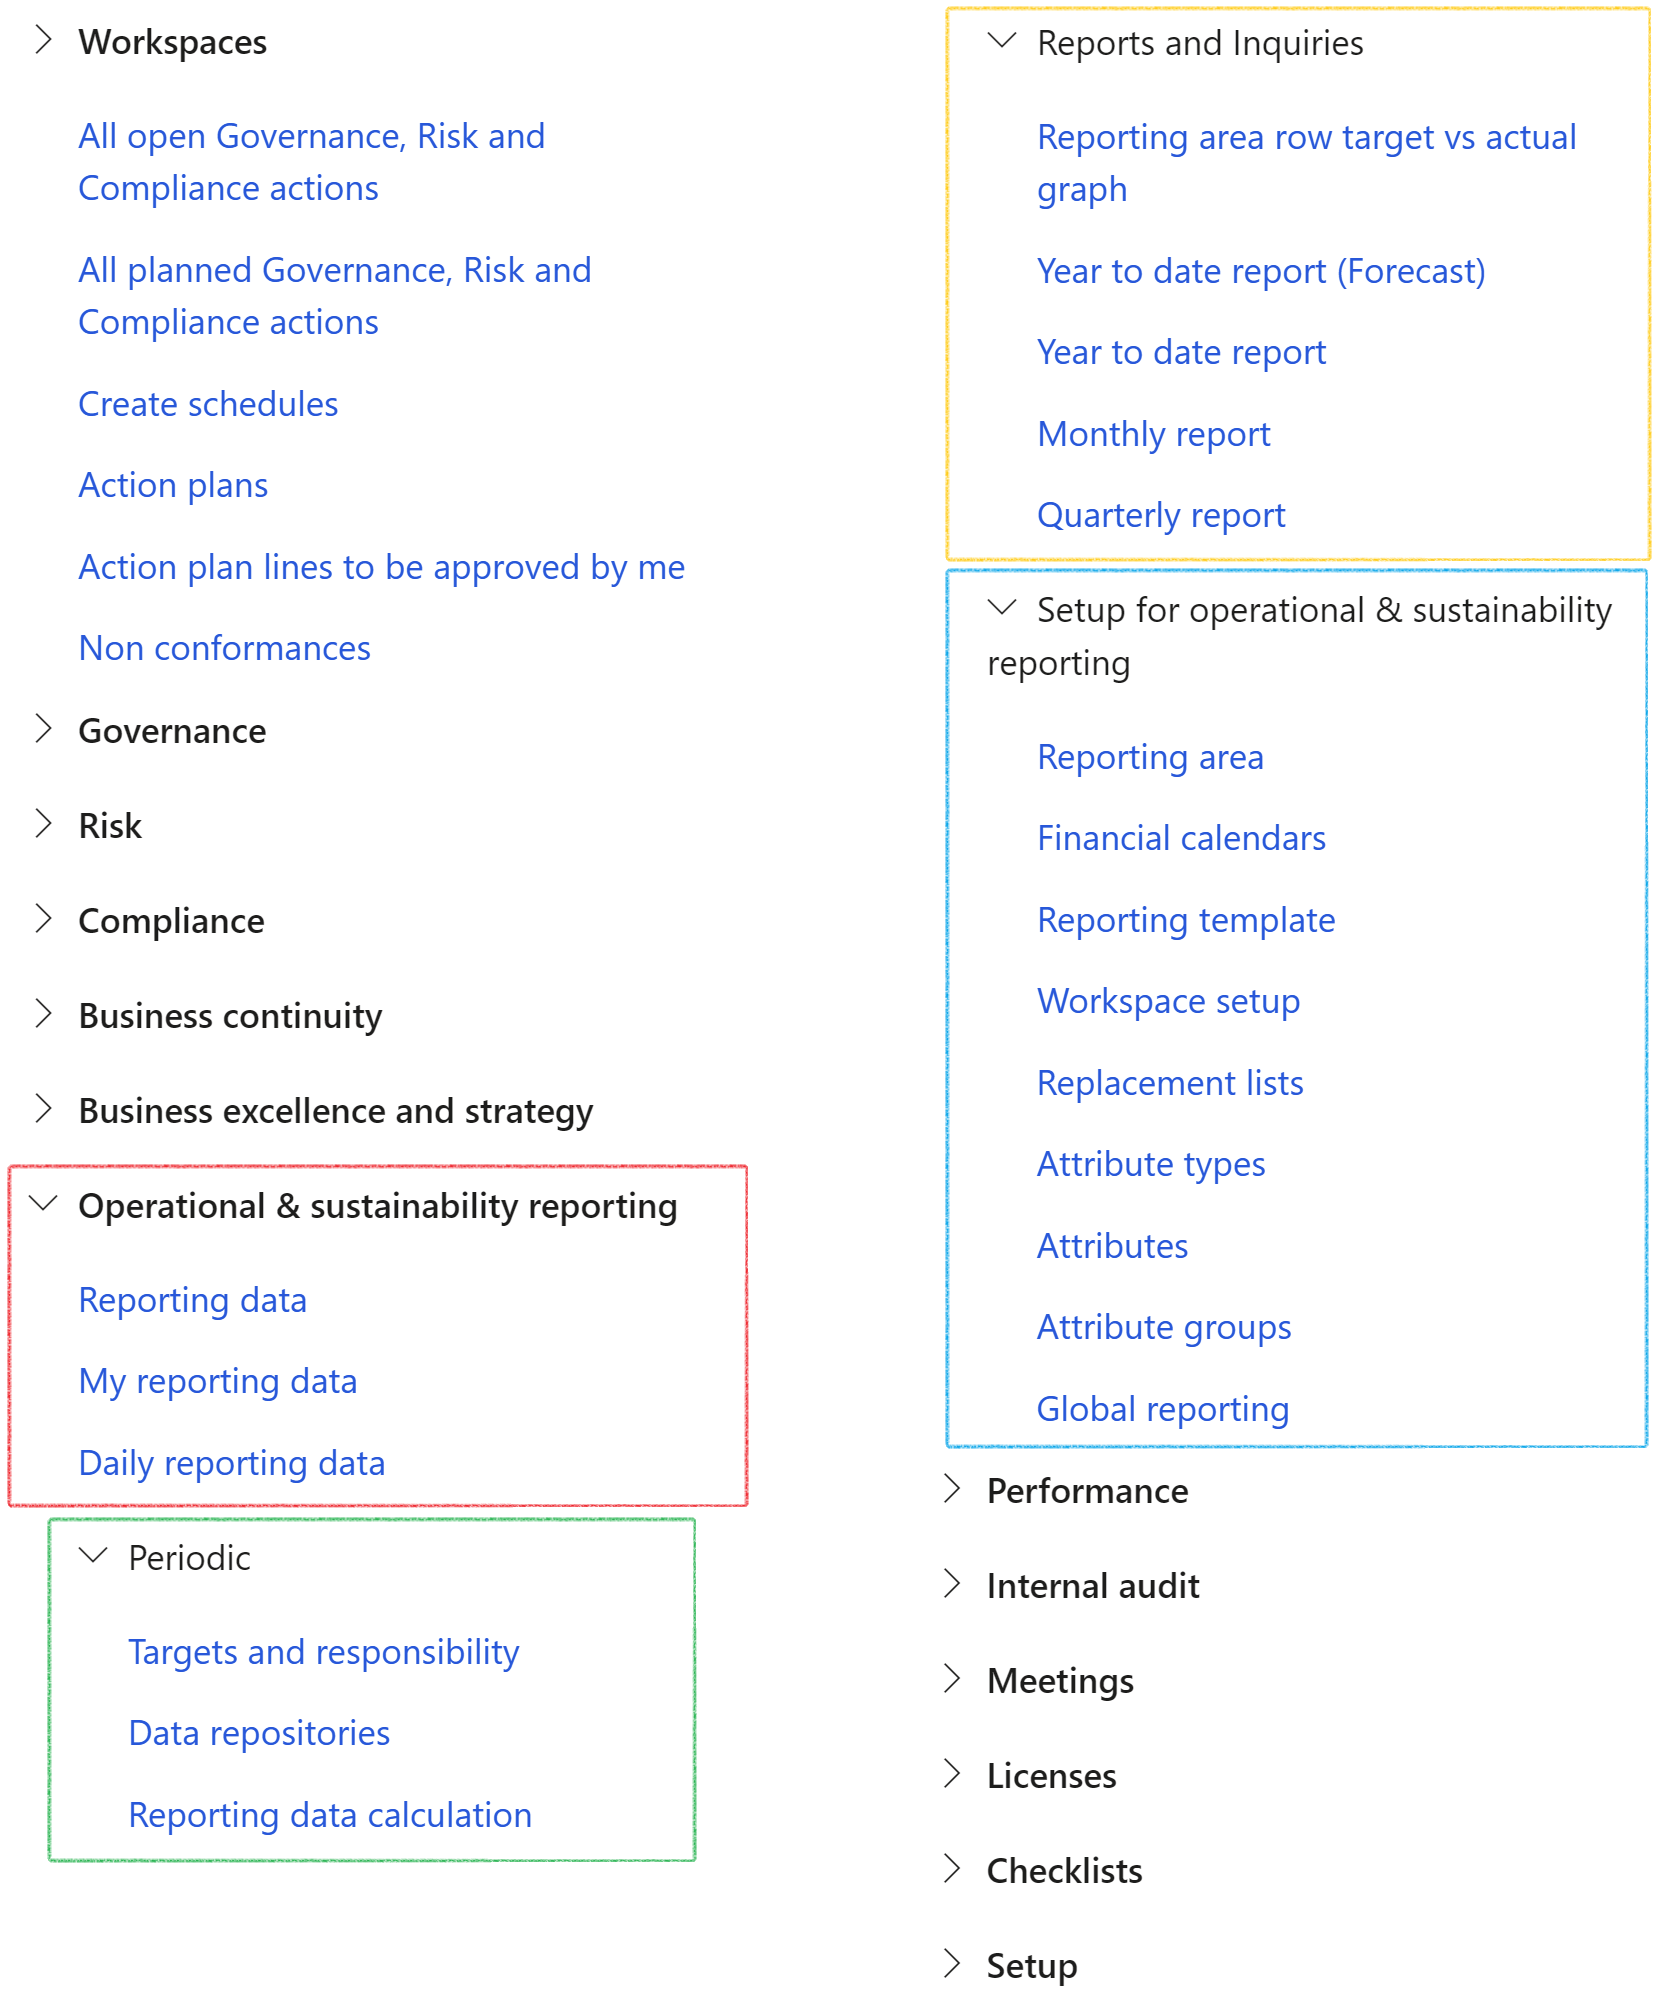
¶ Specific setups
¶ Step 1: Setup Global reporting
Sustainibilty reporting is the practice of measuring, disclosing, and being accountable to internal and external stakeholders for organizational performance towards the goal of sustainible development.
GRI (Global Reporting Initiative) is the independent, international organization that helps businesses and other organizations take responsibility for their impacts, by providing them with the global common language to communicate those impacts.
Go to: GRC > Operational & sustainability reporting > Setup for operational & sustainability reporting > Global reporting
- On the Action pane, click on the New button
- Enter the GR Standard
- Enter the Disclosure number
- Select the G4 disclosure for the combination of GRI standard and Disclosure number entered, from the dropdown list (if applicable).
- Select the Aspect for the combination of GRI standard and Disclosure number entered from the dropdown list (if applicable).
- Select the Category for the combination of GRI standard and Disclosure number entered from the dropdown list (if applicable).
- Enter the Disclosure title for the combination of GRI standard and Disclosure number entered

¶ Step 2: Create Reporting area
The reporting area is used to group similar data together. (For reporting purposes)
Examples of Reporting areas are: Environmental, Production, Medical
Go to: GRC > Operational & sustainability reporting > Setup for operational & sustainability reporting > Reporting area
- On the Action pane, click on the New button
- Enter a unique Area ID for the Reporting area
- In the Description field, enter a descriptive Reporting area name
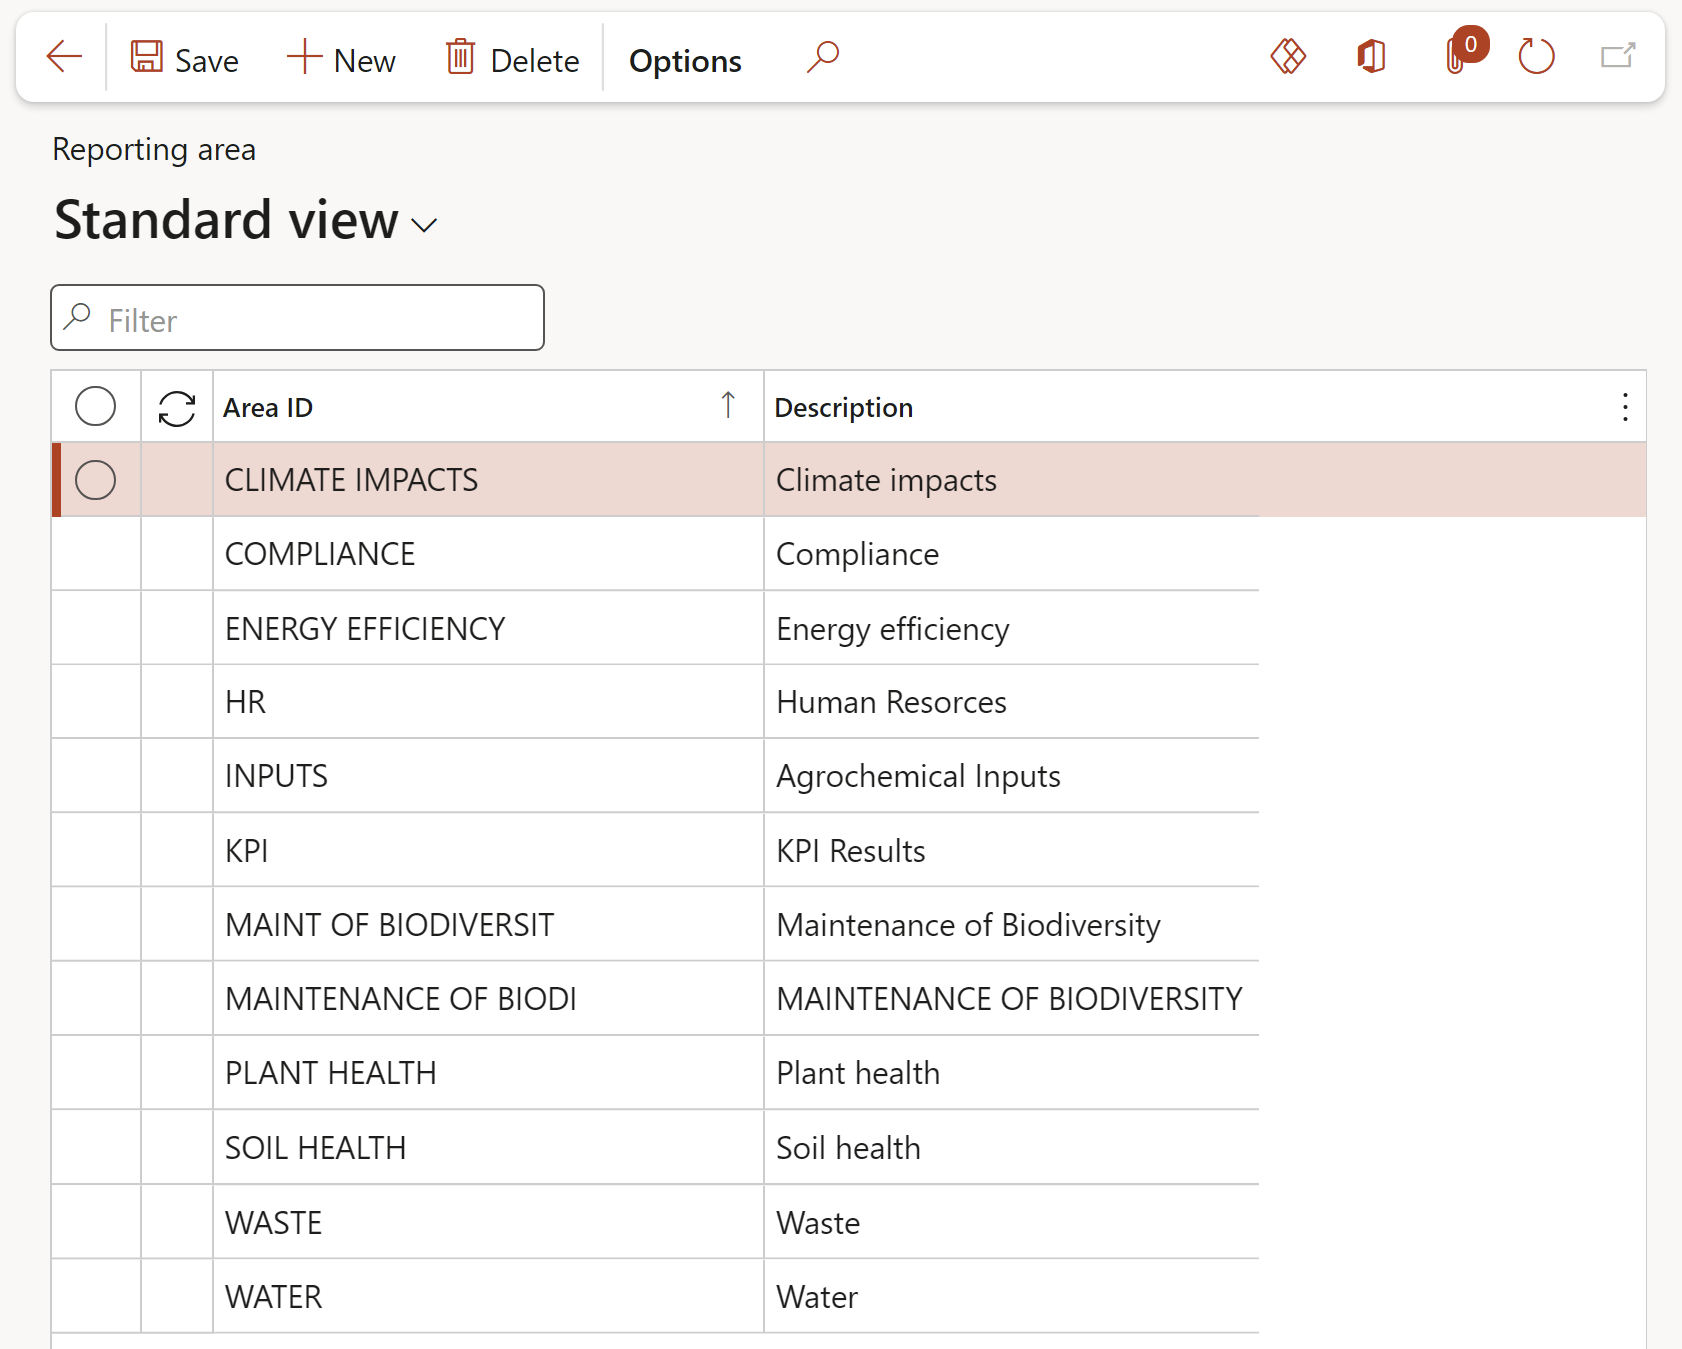
This form can also be used to change the Area name
¶ Step 3: Create a Replacement list
A placeholder with a fixed list of replacement texts, can be set up. The placeholder is used on the reporting template. This will enable the user to select the replacement text on the Targets and responsibility form to tailor the template for a specific site.
For example:
One can setup a list where the placeholder is Fruit with a list of replacement texts e.g. ‘Avocados’, ‘Mangoes’ and ‘Nuts’. On the template one can then setup a line Monthly yield of @Fruit@ where @Fruit@ is the placeholder.
On the Targets and responsibility from the user can now select the replacement text for @Fruit@, say Avocados, from this pre-defined list, for the specific site.
On the form where the data is captured, as well as on the graphs and reports, this line will now show Monthly yield of Avocados. Please note that the Unit of measure that is setup on the Replacement text will also be copied to the line.
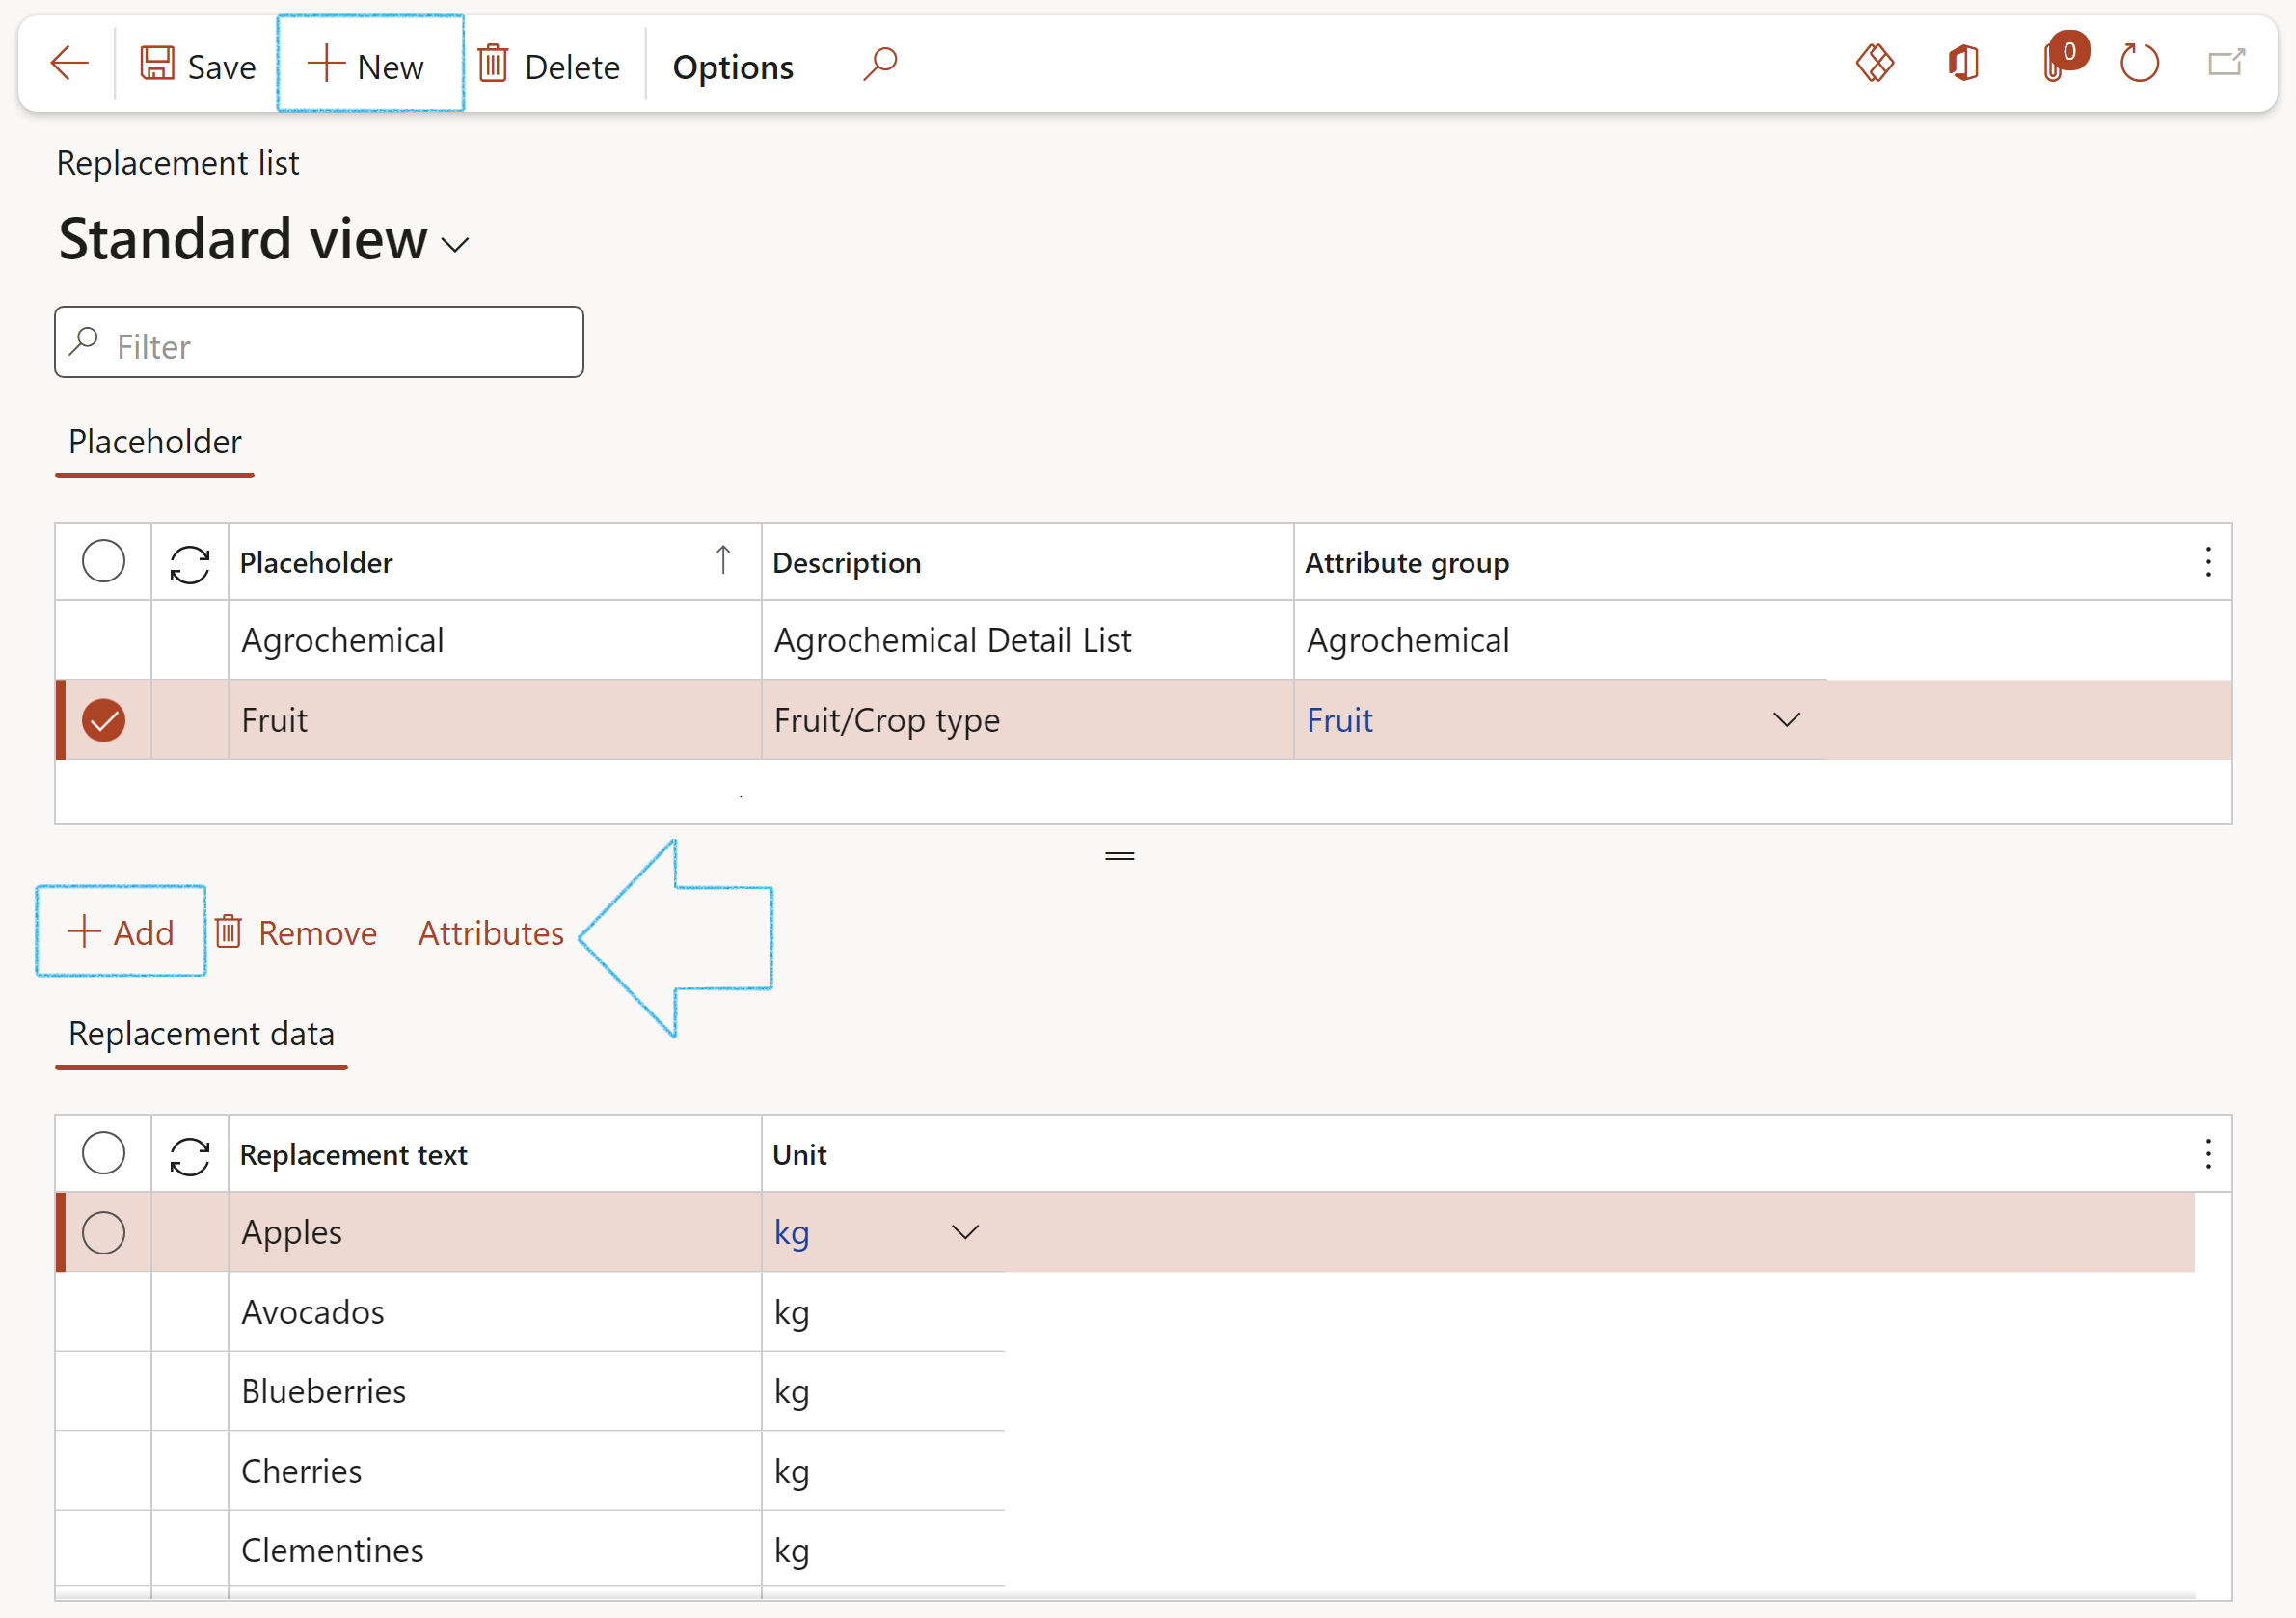
Go to: GRC > Operational & sustainability reporting > Setup for operational & sustainability reporting > Replacement lists
- On the Action pane, click on the New button
- Under the Placeholder section, enter a name for the placeholder
- Enter a Description for the placeholder
- Under the Replacement data section, in the Button strip, click on the Add button
- Enter a Replacement text
- Select the relevant Unit of measure from the dropdown list
- Click on the Attributes button to view the attributes of the selected replacement text
Creating Attributes and Attribute groups is standard Microsoft functionality. Axnosis is not responsible for maintaining the website.
Manage attributes and attribute groupsThe following Data entity is available for uploading attribute values: OHSReportingReplacementInstanceValueEntity
¶ Step 4: Create a Reporting template
The Reporting template is used to setup a list of records that will be used for the reporting data.
Go to: GRC > Operational & sustainability reporting > Setup for operational & sustainability reporting > Reporting template
- On the Action pane, click on the New button
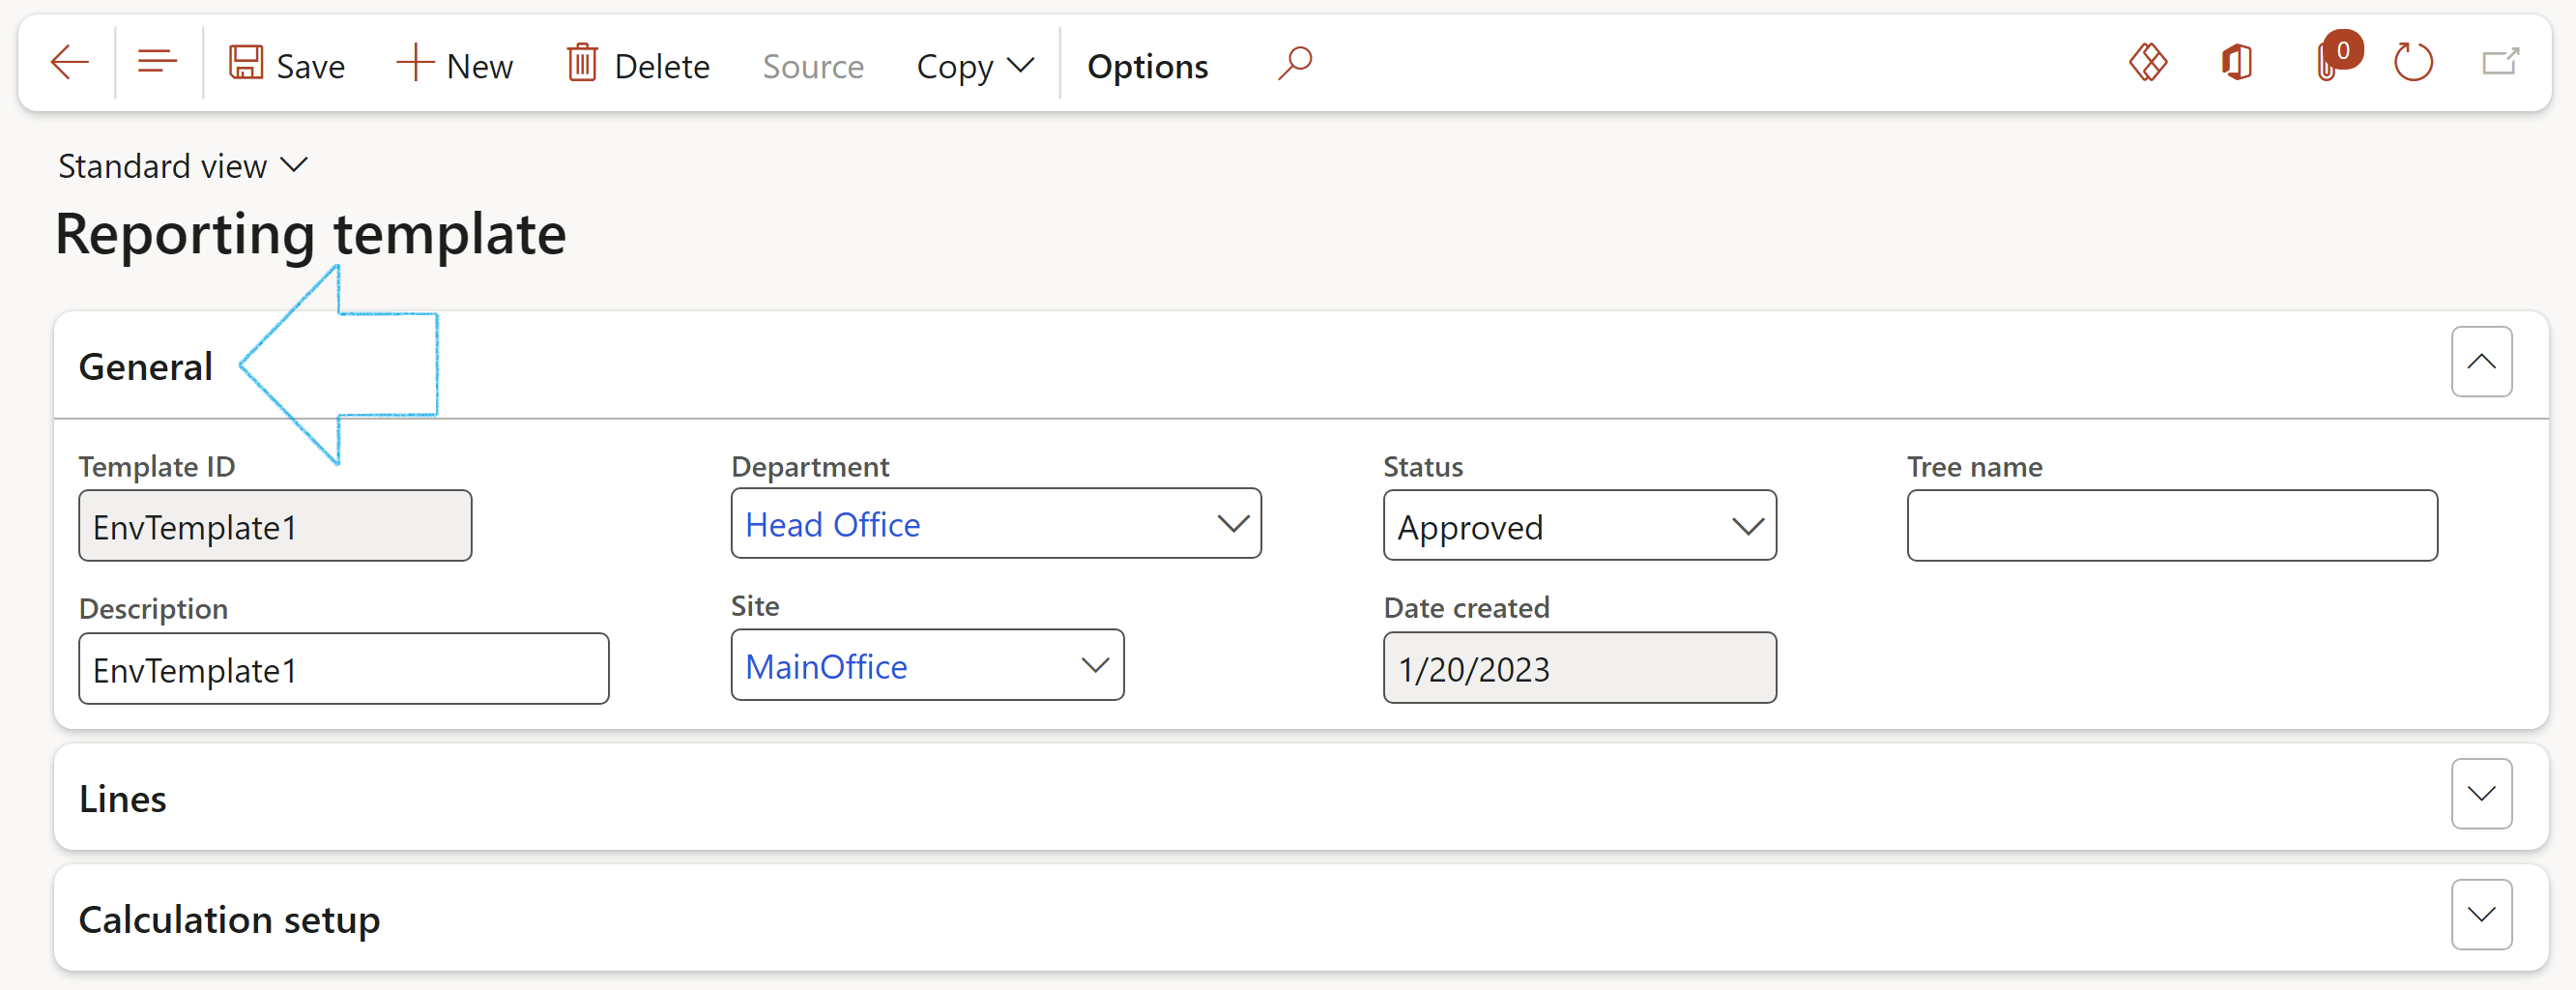
¶ Step 4.1: The General Fast tab
- Enter a unique Template ID
- Enter a brief Description for the template
- Select the relevant Department from the dropdown list
- Select the relevant Site from the dropdown list
- Tree name (for future use)
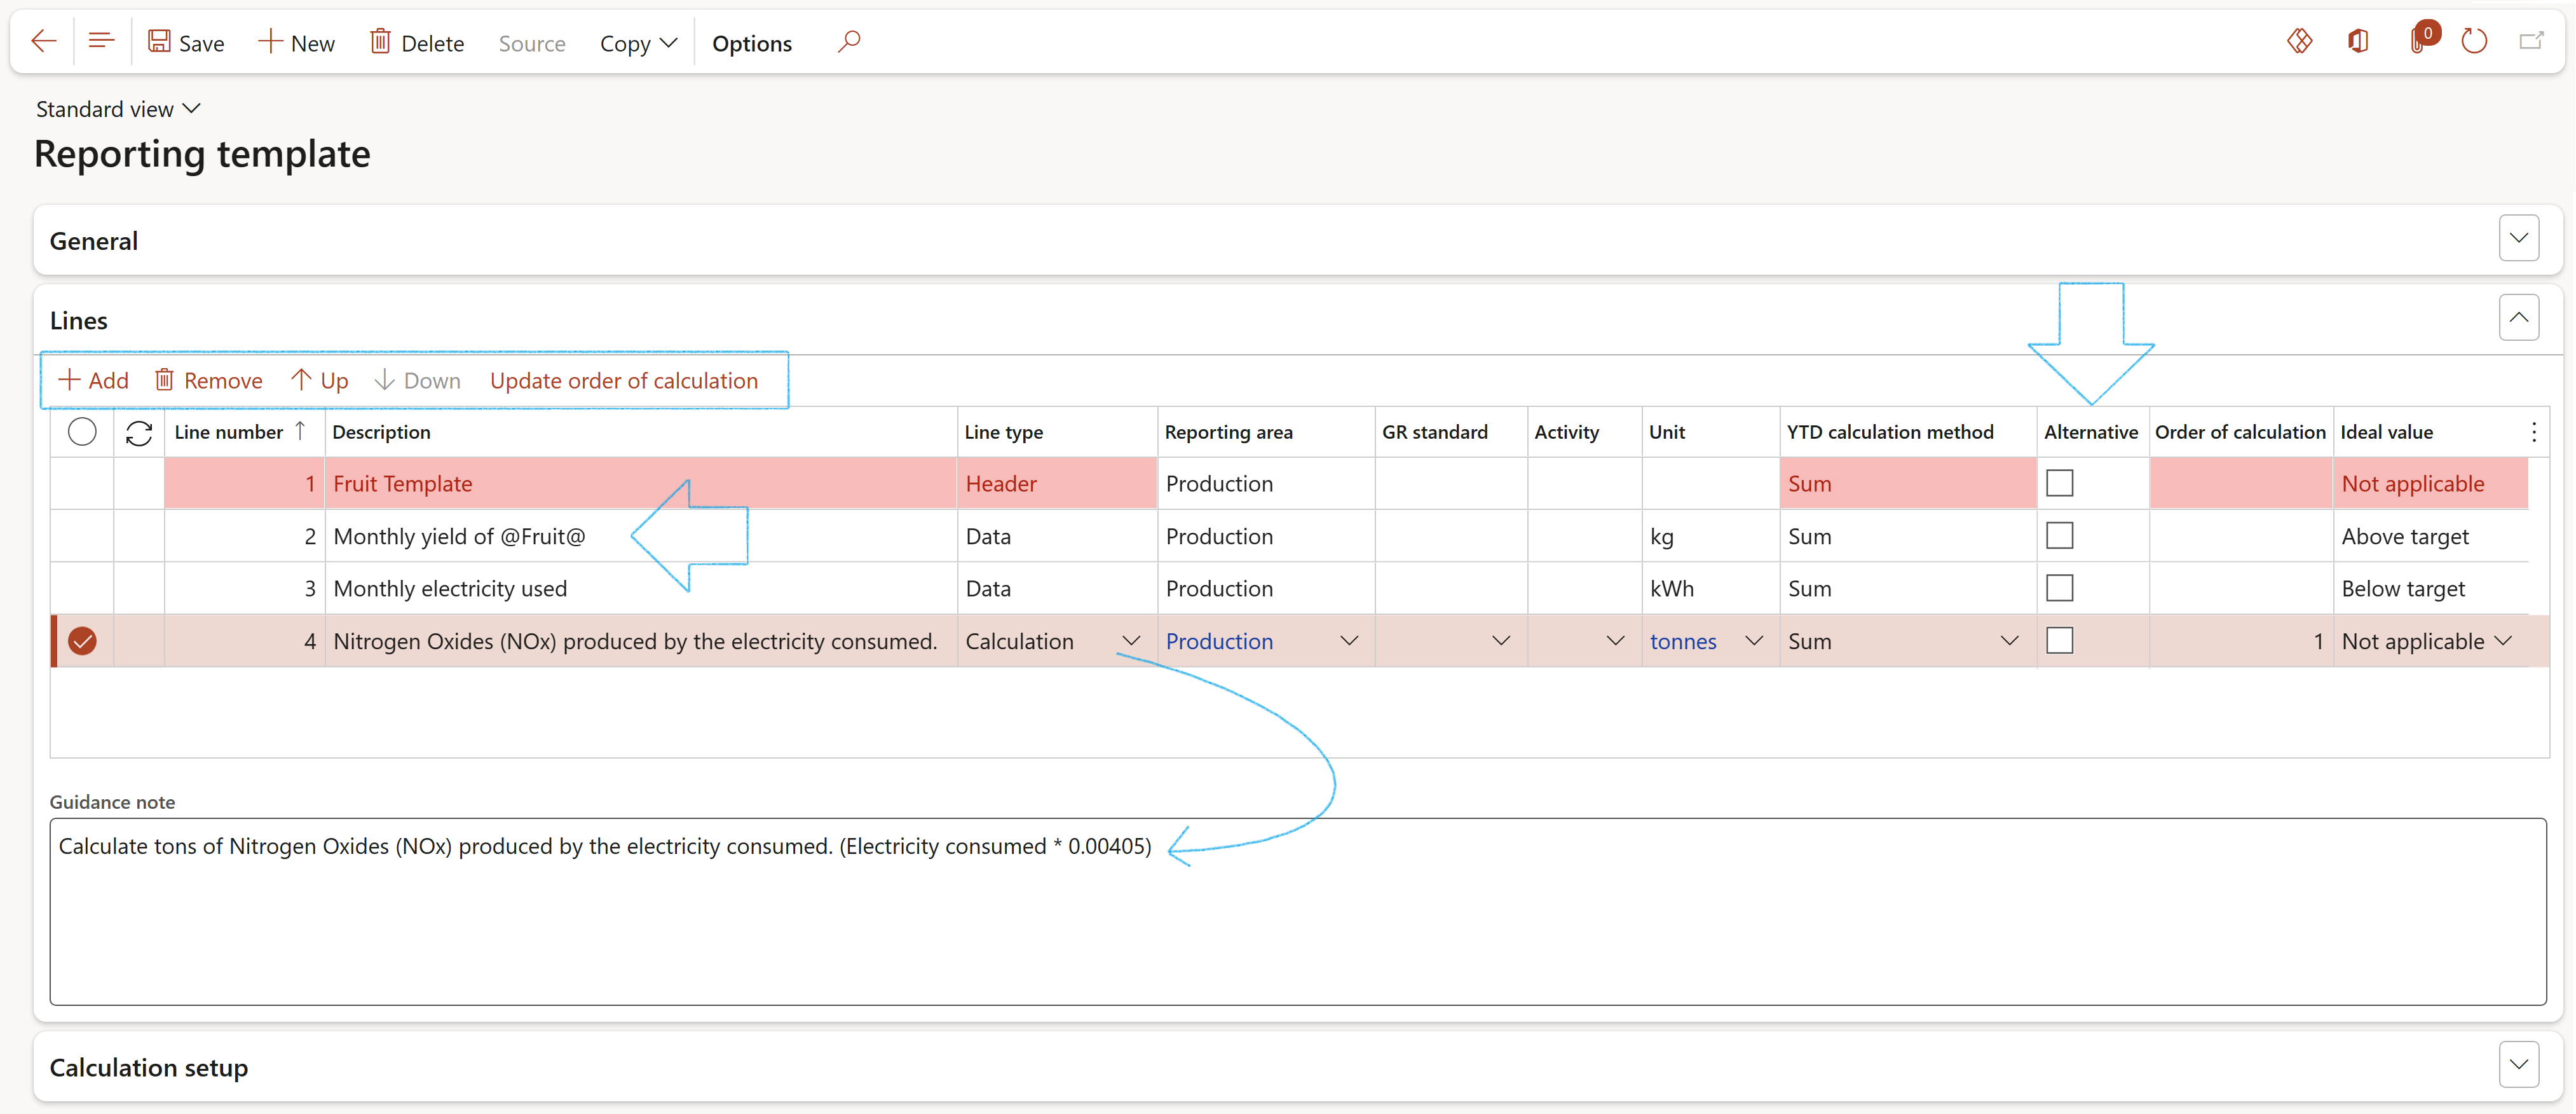
¶ Step 4.2: The Lines Fast tab
- In the Button strip, click on the Add button
- Enter a Description for the data template row. Remember to use the @ symbol where replacement text is to be used. (Refer to Step 2 above)
- Select the relevant Line type from the dropdown list
- The following options are available:
- Data: This is used for a record where the user will enter data
- Header: This allows the user to add a header record. This enables the user to group the records
- Calculation: This record will be calculated by the system, using the calculations that have been setup under the Calculation setup Fast tab
- Source: The Source button in the Action pane becomes available. This will allow data to become available on the Reporting data form, from the Asset counters. (See Step 4.2.1 below)
- Select the relevant Reporting area from the dropdown list
- Select the relevant GR standard from the dropdown list (if applicable)
- Select the relevant Activity (Process and activity) from the dropdown list (if applicable)
- Select the relevant Unit of measure from the dropdown list
- Select the relevant YTD calculation method from the dropdown list
- The following options are available:
- Sum: This indicates that the YTD monthly and quarterly values will be summed. Example: Total number of incidents.
- Last: This indicates that the YTD monthly and quarterly values will be the latest value. Example: The current number of employees.
- Average: This indicates that the YTD monthly and quarterly values will be the average value. Example: The current number of employees
- Tick the Alternative box to do an alternative calculation of the YTD values for the summary method
- Enter the Order of the calculation for the line
- Select the relevant Ideal value from the dropdown list
- The following options are available:
- Not applicable
- Below target
- Above target
- Guidance notes are entered (per line) in the Guidance note memo box, to ensure that the user understands what the requirements are for the data that must be captured.
When the Alternative box is ticked: YTD is calculated by as follows (month1 energy use + month2 energy use)/(month1 tonnes + month2 tonnes)
When the Alternative box is not ticked: YTD is calculated by adding the results month by month ((month1 energy use/tonnes) + (month2 energy use/tonnes))
- Use the Up and Down buttons to move the selected line up or down
- When you have finished creating the Reporting template, or if you have made changes to it, click on the Update order of calculation button
¶ Step 4.2.1: Where data must come from Asset counters
- On the Reporting template, select the relevant line (the line type must be Source)
- In the Action pane, click on the Source button
- On the Source for the reporting template line dialog:
- In the Source type field, select Asset counters from the dropdown list
- Select the relevant Asset from the dropdown list
- Select the relevant Asset type from the dropdown list
- Select the relevant Functional location from the dropdown list
- Select the relevant Counter from the dropdown list
- Click on the OK button

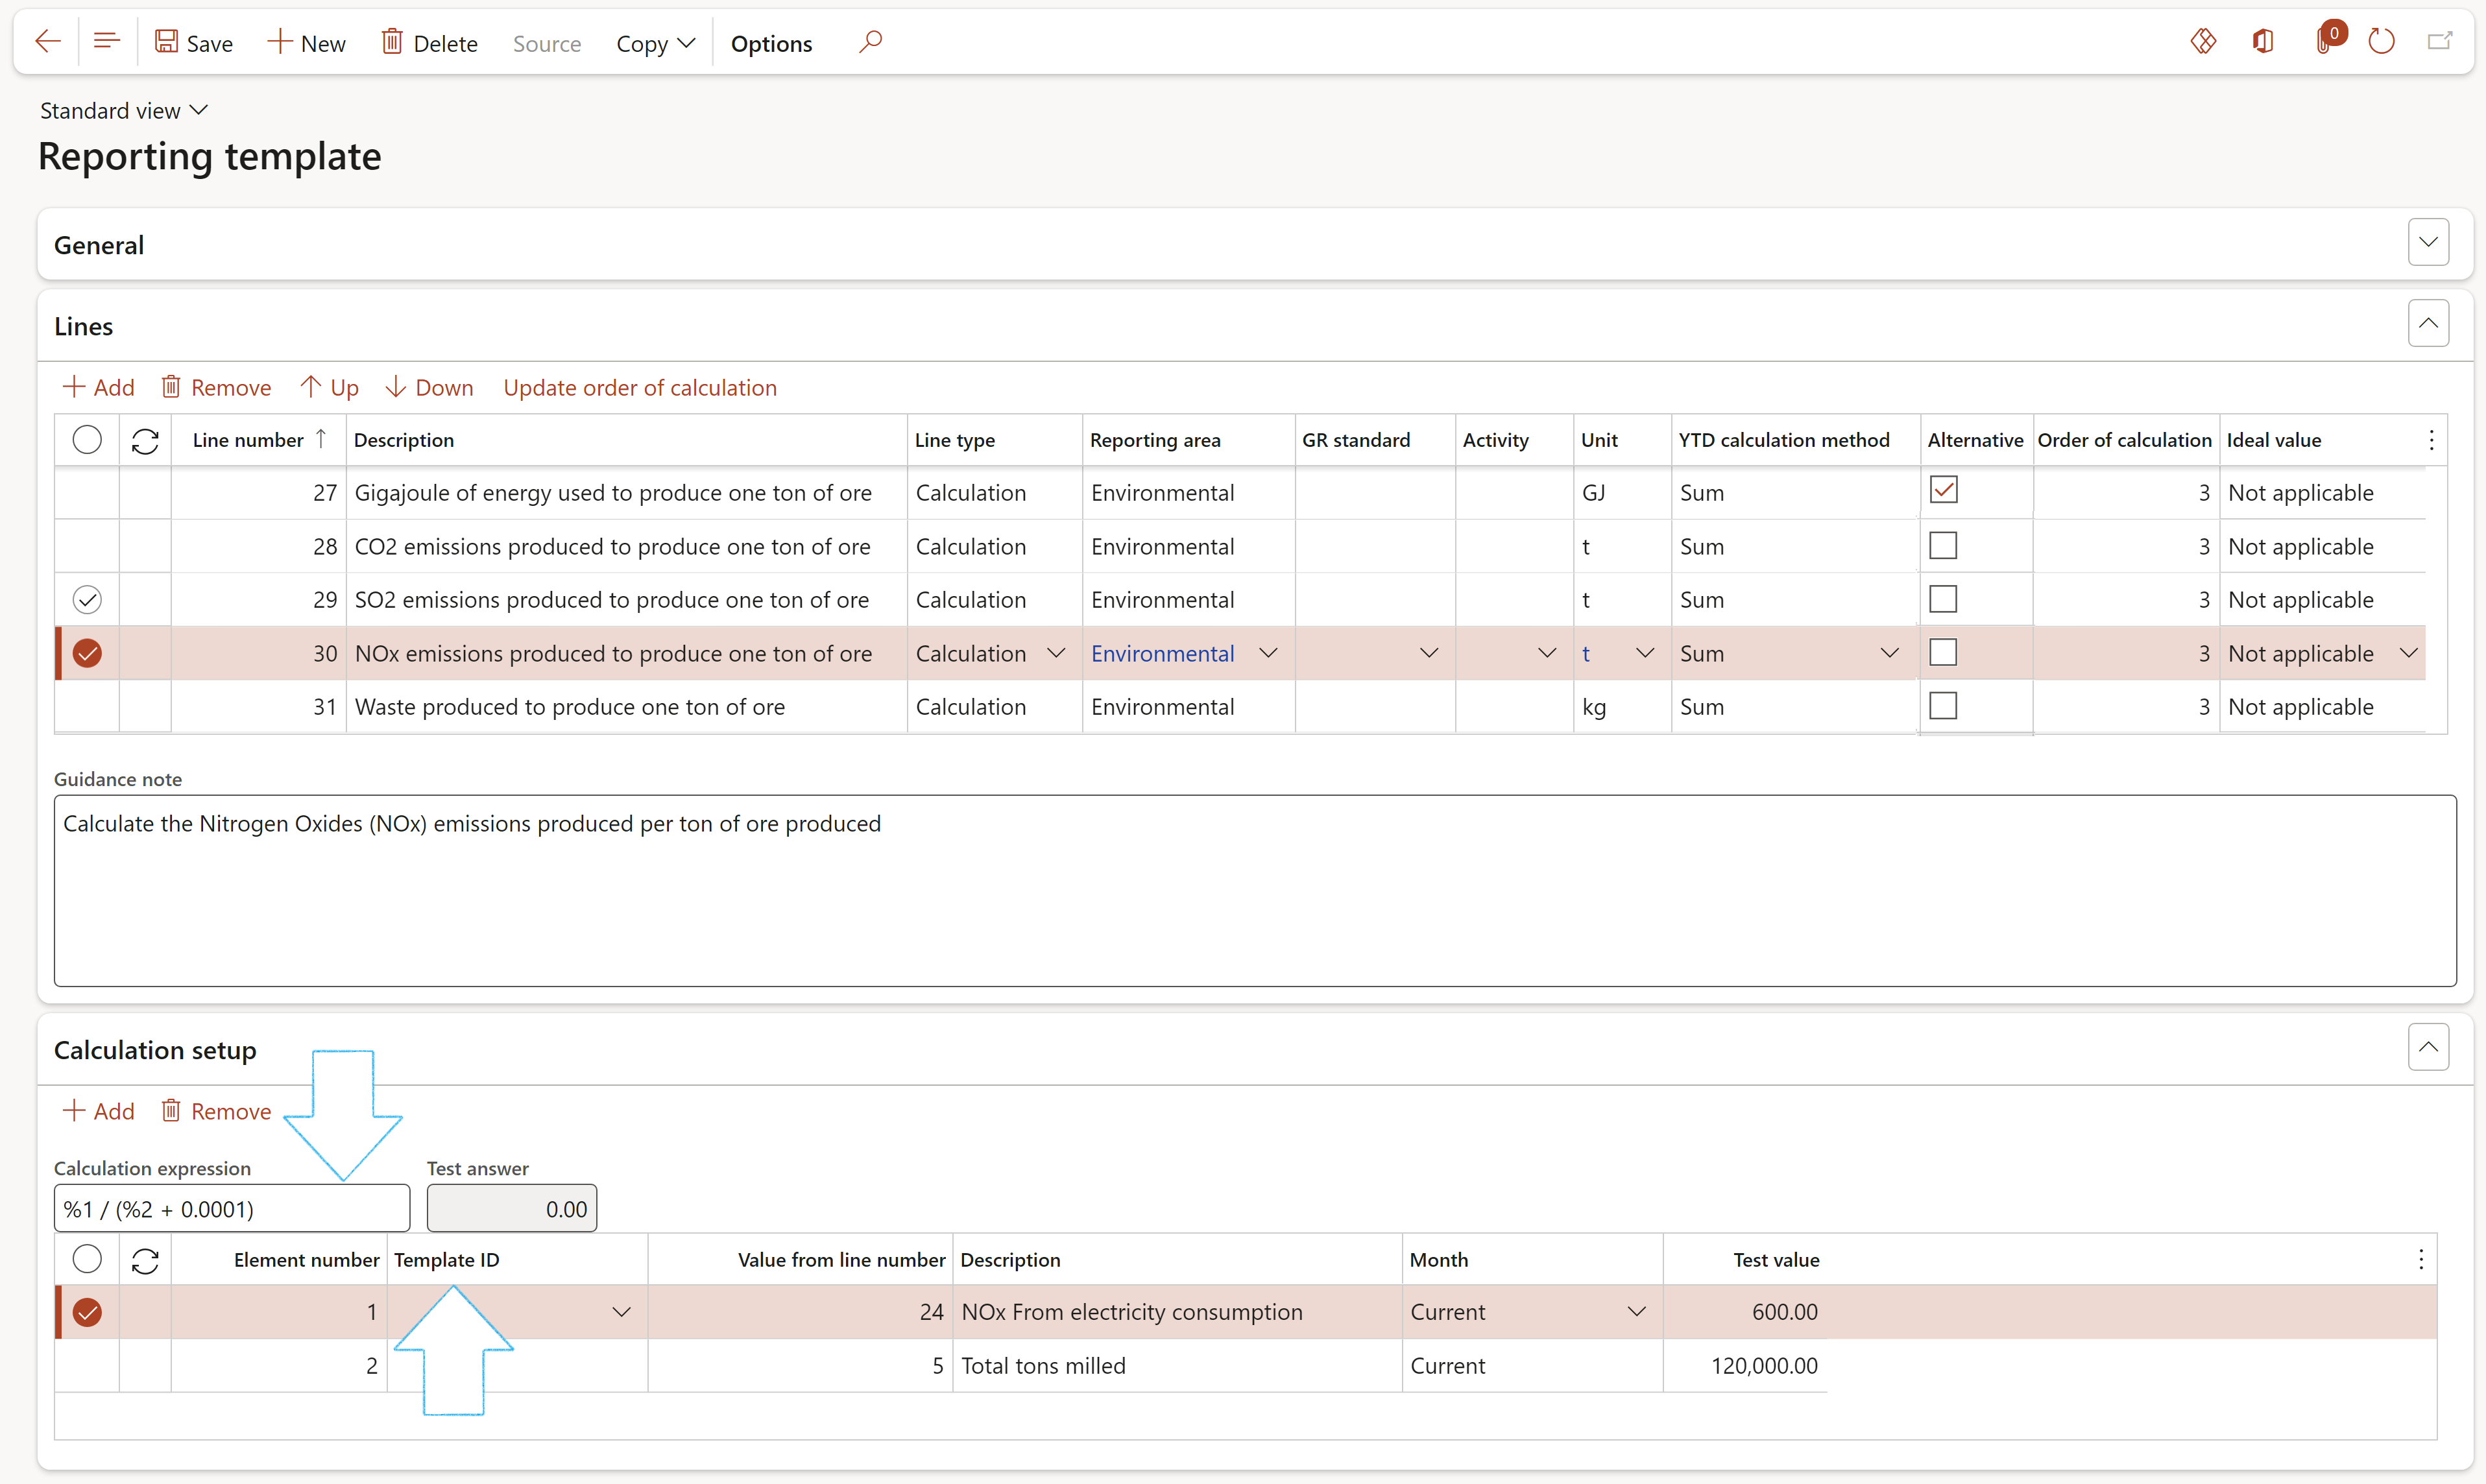
¶ Step 4.3: Calculation setup Fast tab
The user can maintain/setup calculations for the records under the General Fast tab.
- In the Button strip, click on the Add button
The Add button is only available when the Line type is set to Calculation under the Lines Fast tab
- Enter the Element number
- If it is required that a value from a different Reporting template line should be used in the calculation, the user has the option to select the relevant Template ID from the dropdown list, and to enter the relevant line number in the Value from line number field
- In the Value from line number field, enter the line number (from the Lines Fast tab) that must be used for this element in the calculation
- The description of the selected record will be displayed in the Description field
- In the Month field, the user has the option to use the value from the Current month or the Previous month for the calculation
- A value can be entered in the Test value field to test the calculation
- In the Calculation expression field, enter the calculation expression (Placeholders [%1, %2, %3, etc.] can be used in the calculation expression)
Use % as a placeholder followed by the element number. E.g. %1 / (%2 + 0.001)
Valid operators in the Calculation expression fied are: - + * / ( )
Decimals should be denoted with .
¶ Step 4.4: Copy a Reporting template
- In the Action pane, click on the Copy button
- On the drop-dialog, enter the New reporting template ID
- Click on OK
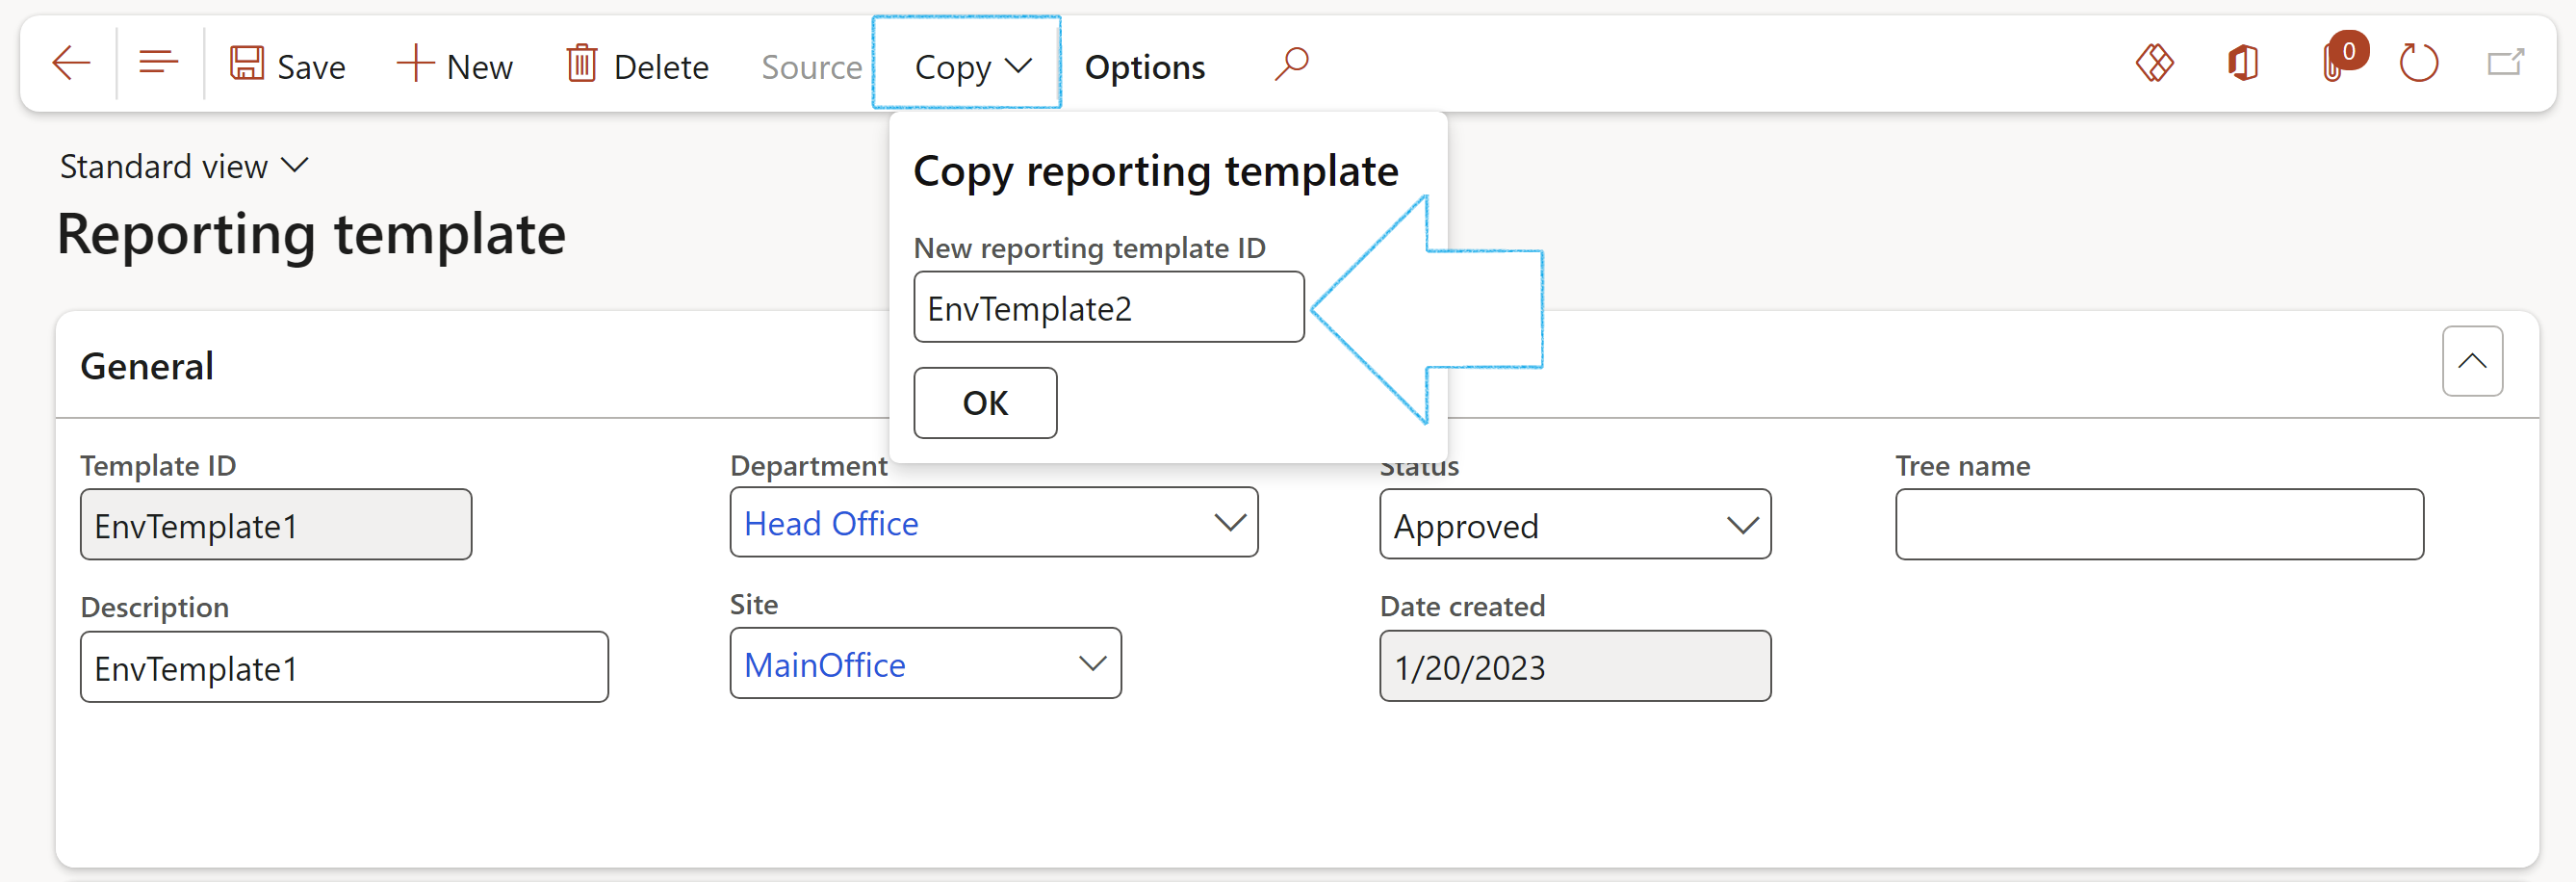
The user can now change the following detail on the copied reporting template:
- Description
- Department
- Site
- The Status will by default be Created but can be changed
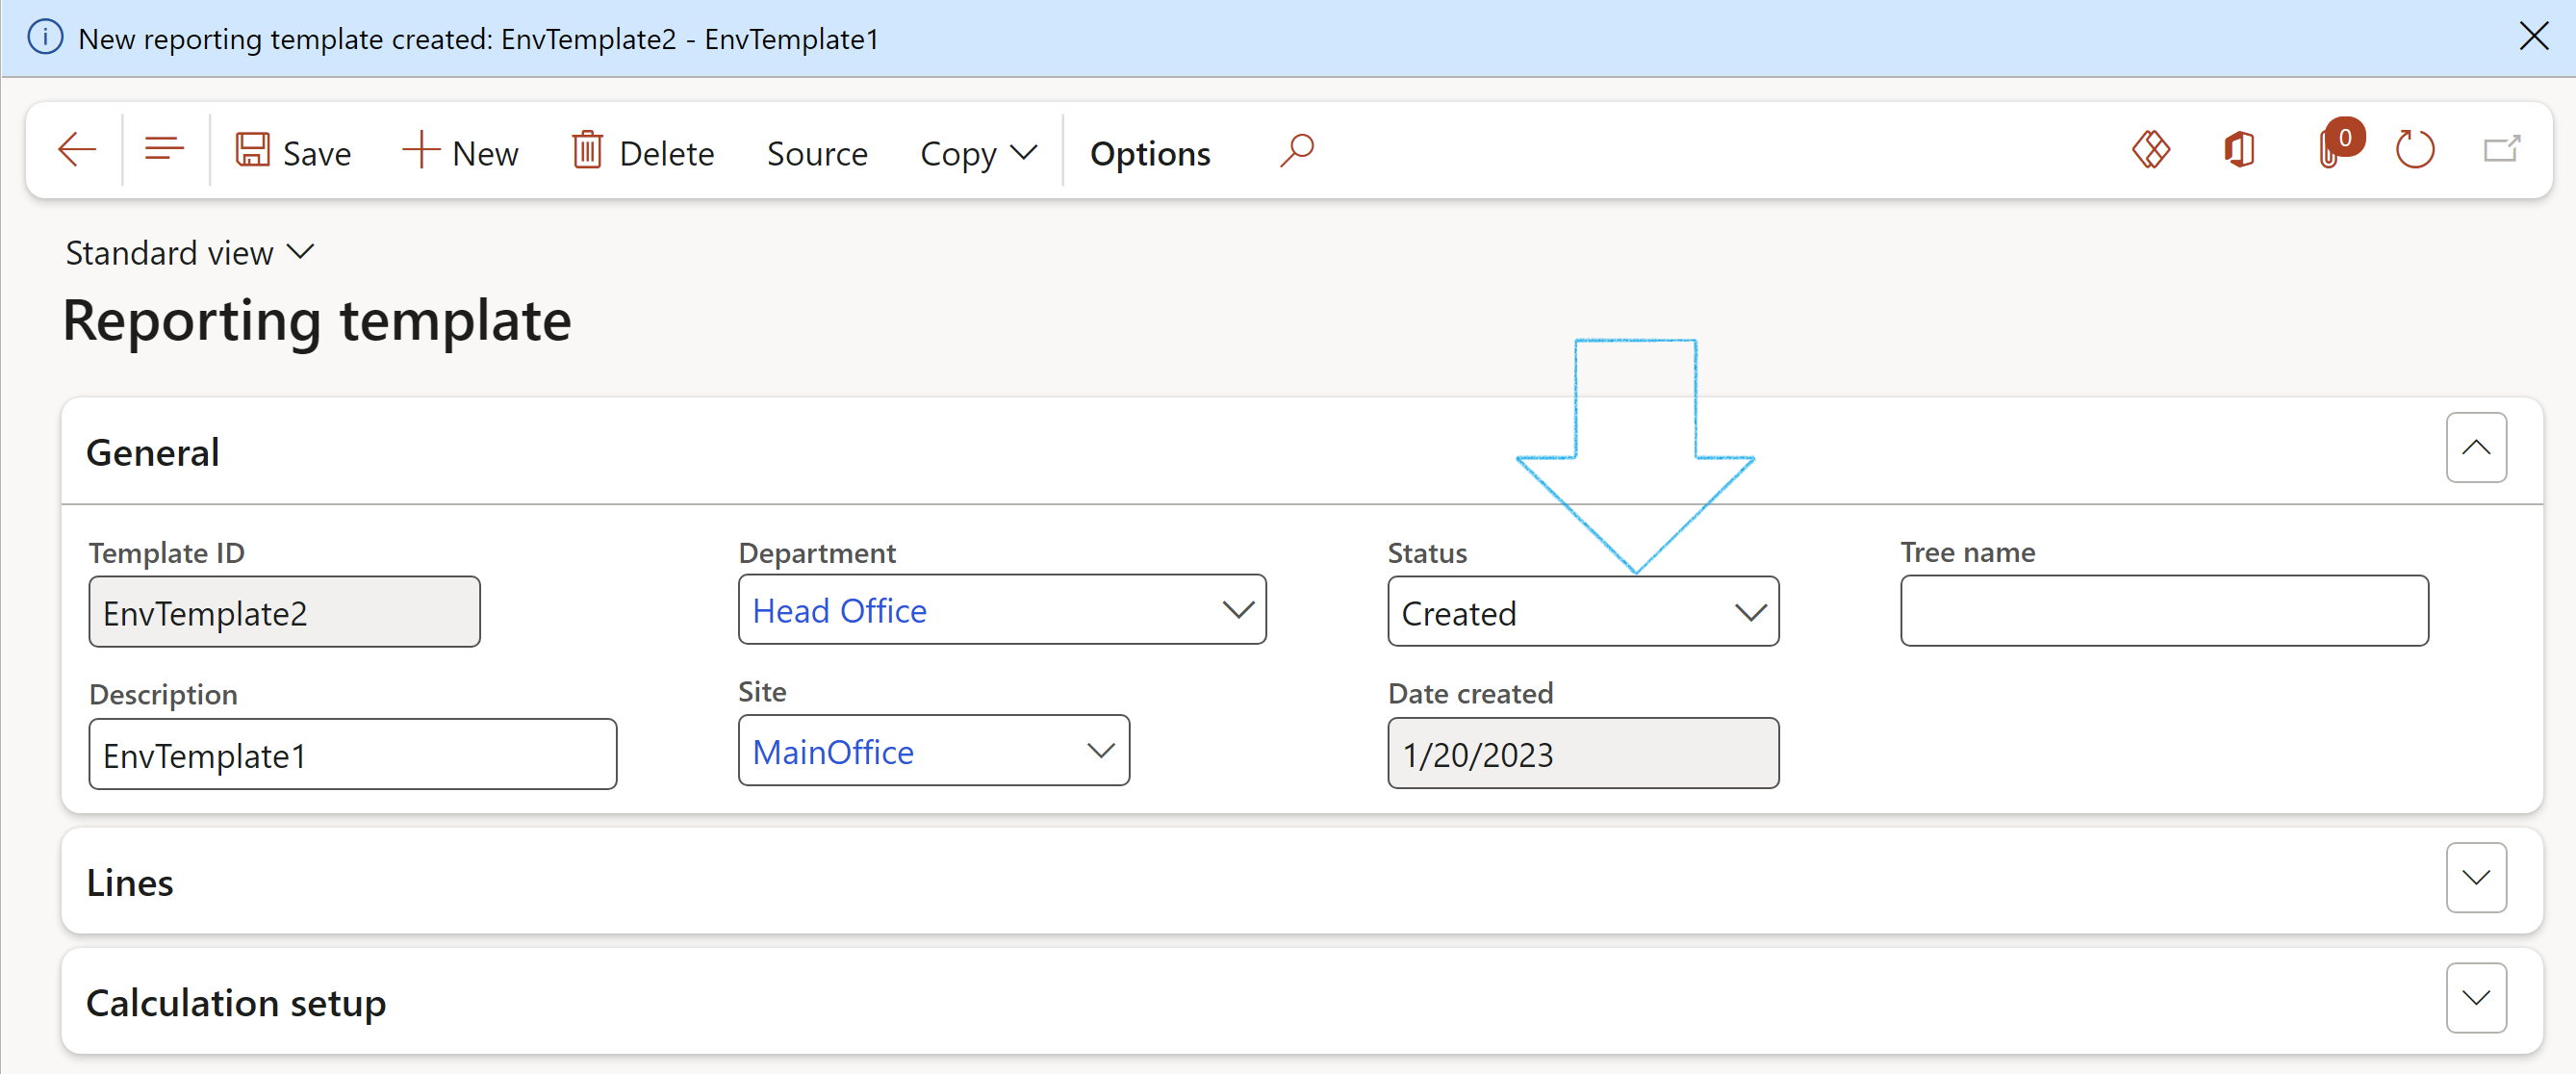
All the detail under the Lines Fast tab and Calculation setup Fast tab will be copied to the new Reporting template
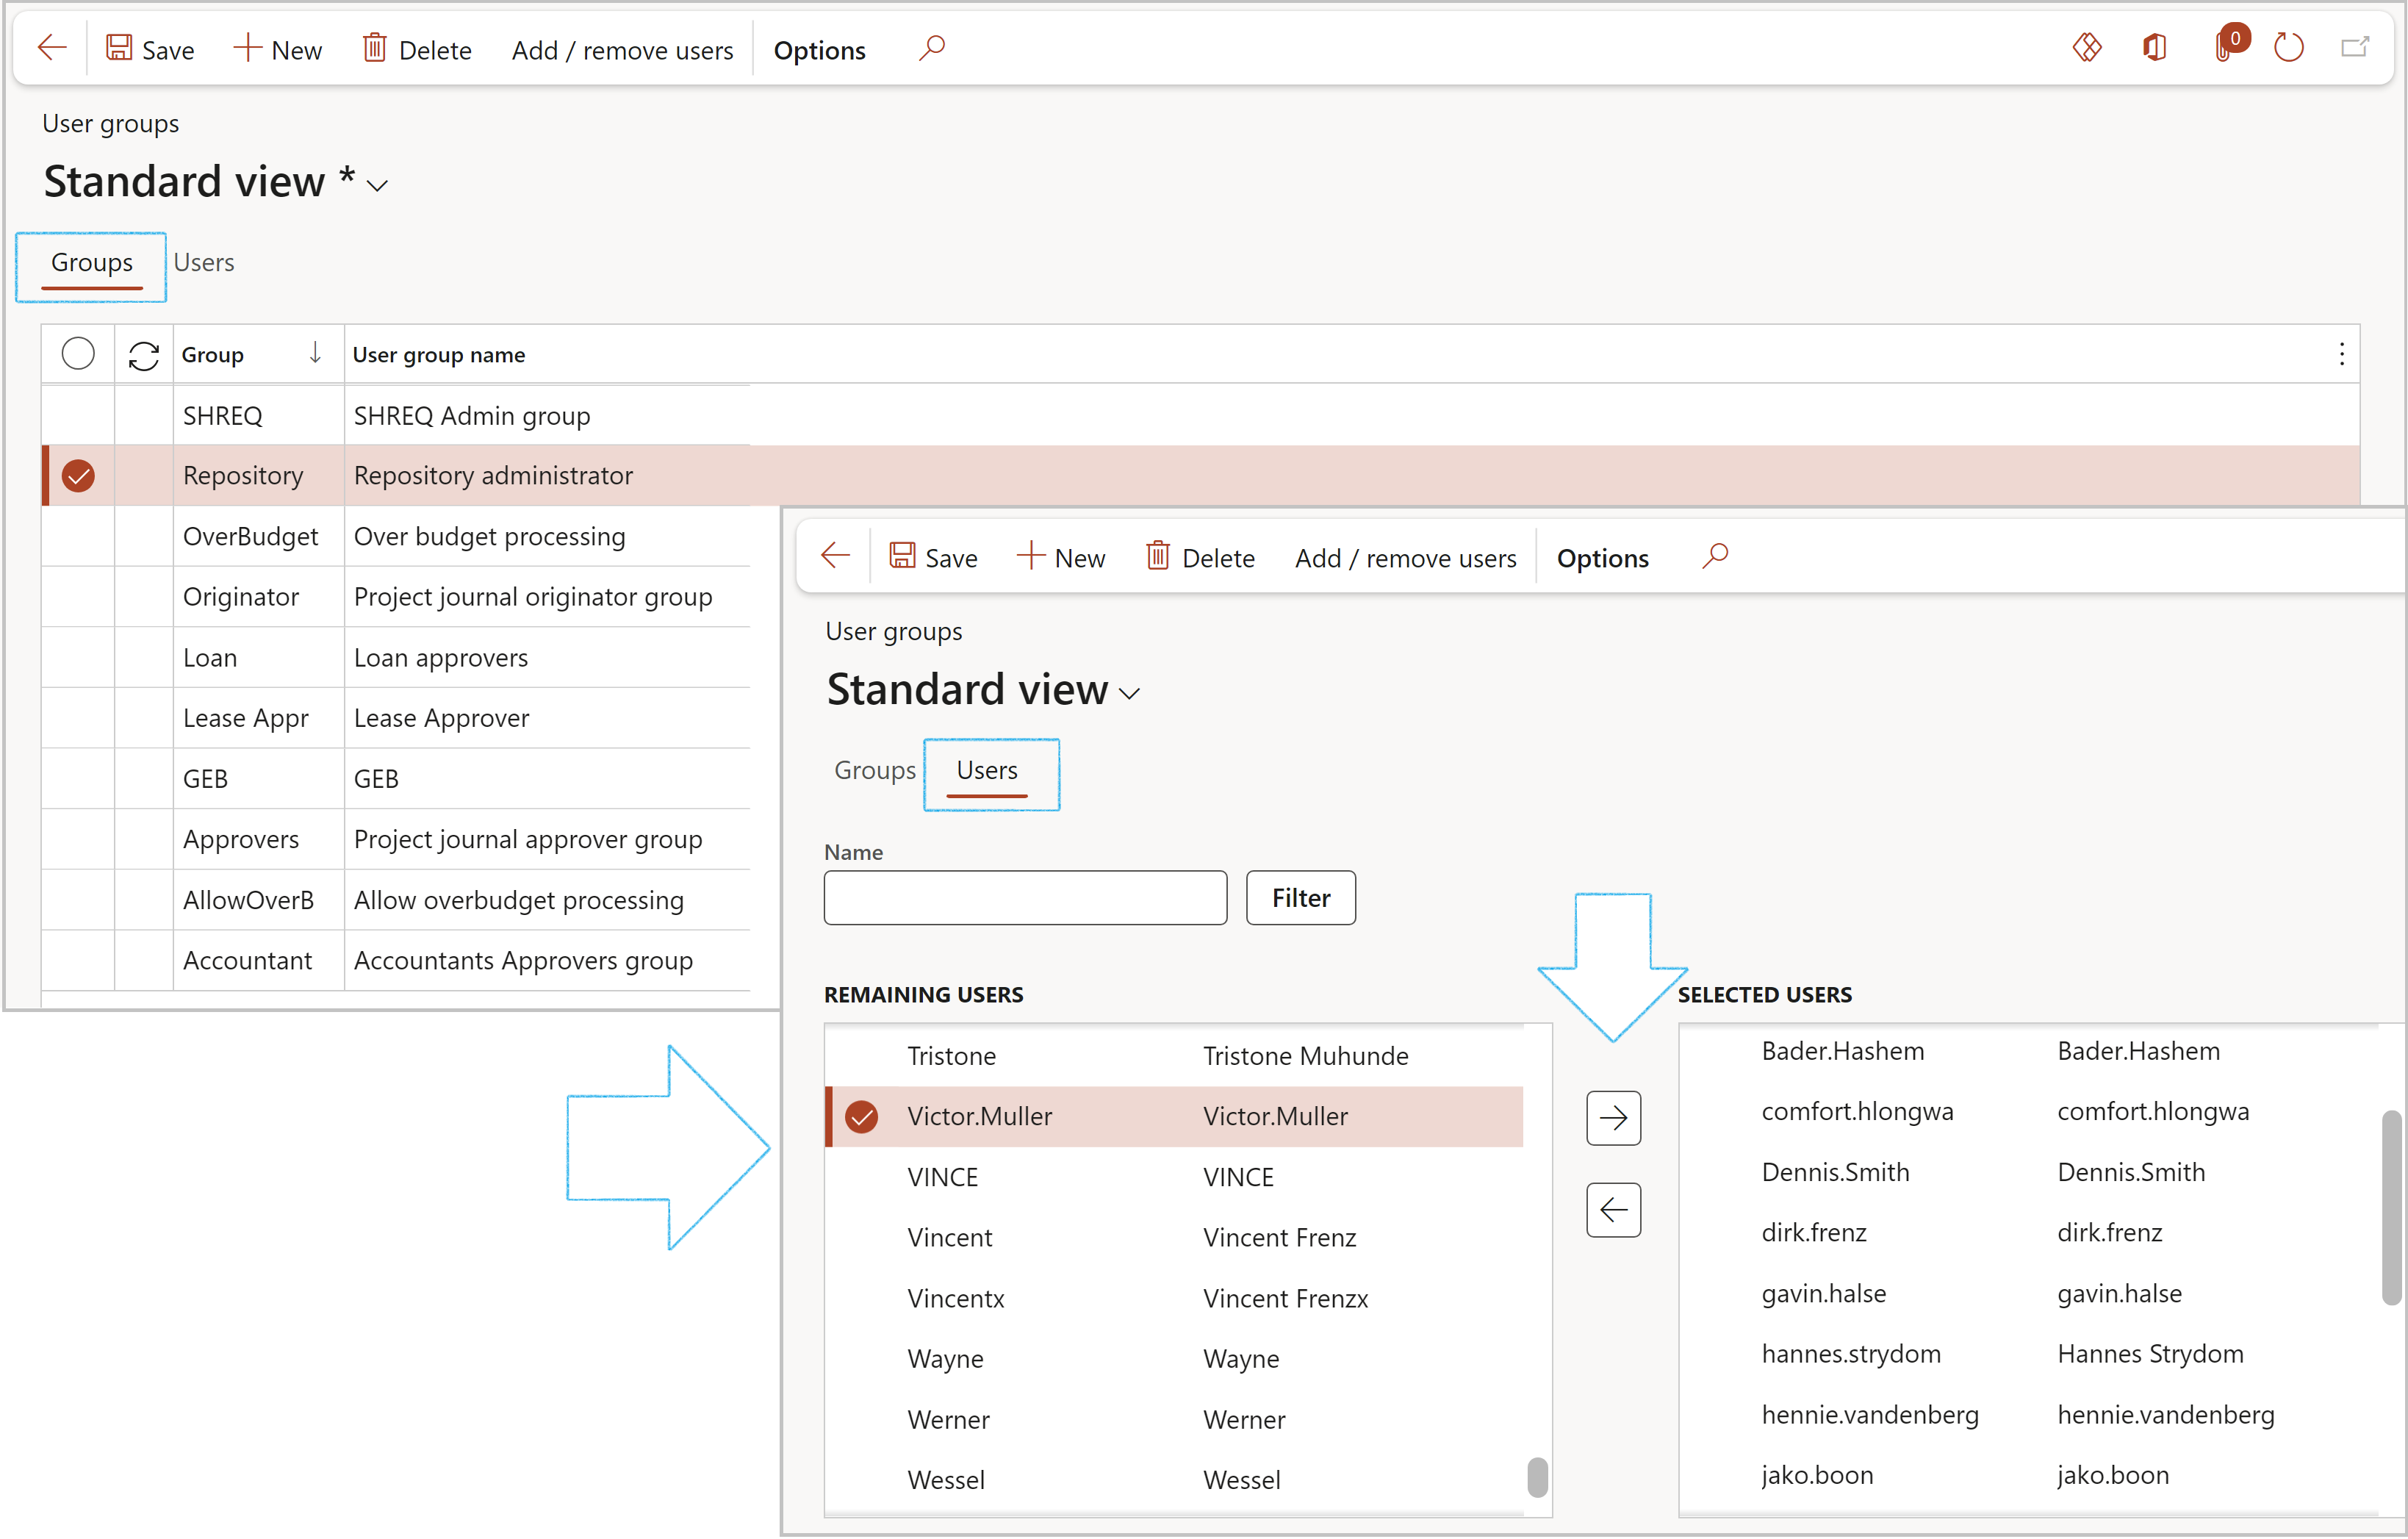
¶ Step 5: Create Admin user group
Only users that belong to the Repository administrator user group, can change the data in the repository when the period is closed.
Go to: System administration > Users > User groups
- In the Action pane, click on the New button
- Under the Groups Index tab, enter a Group ID
- Enter a User group name
- Open the Users Index tab
- Select the names of the users that you want to add to the User group from the REMAINING USERS column and click on the -> button to move them accross to the SELECTED USERS column
- Click Save
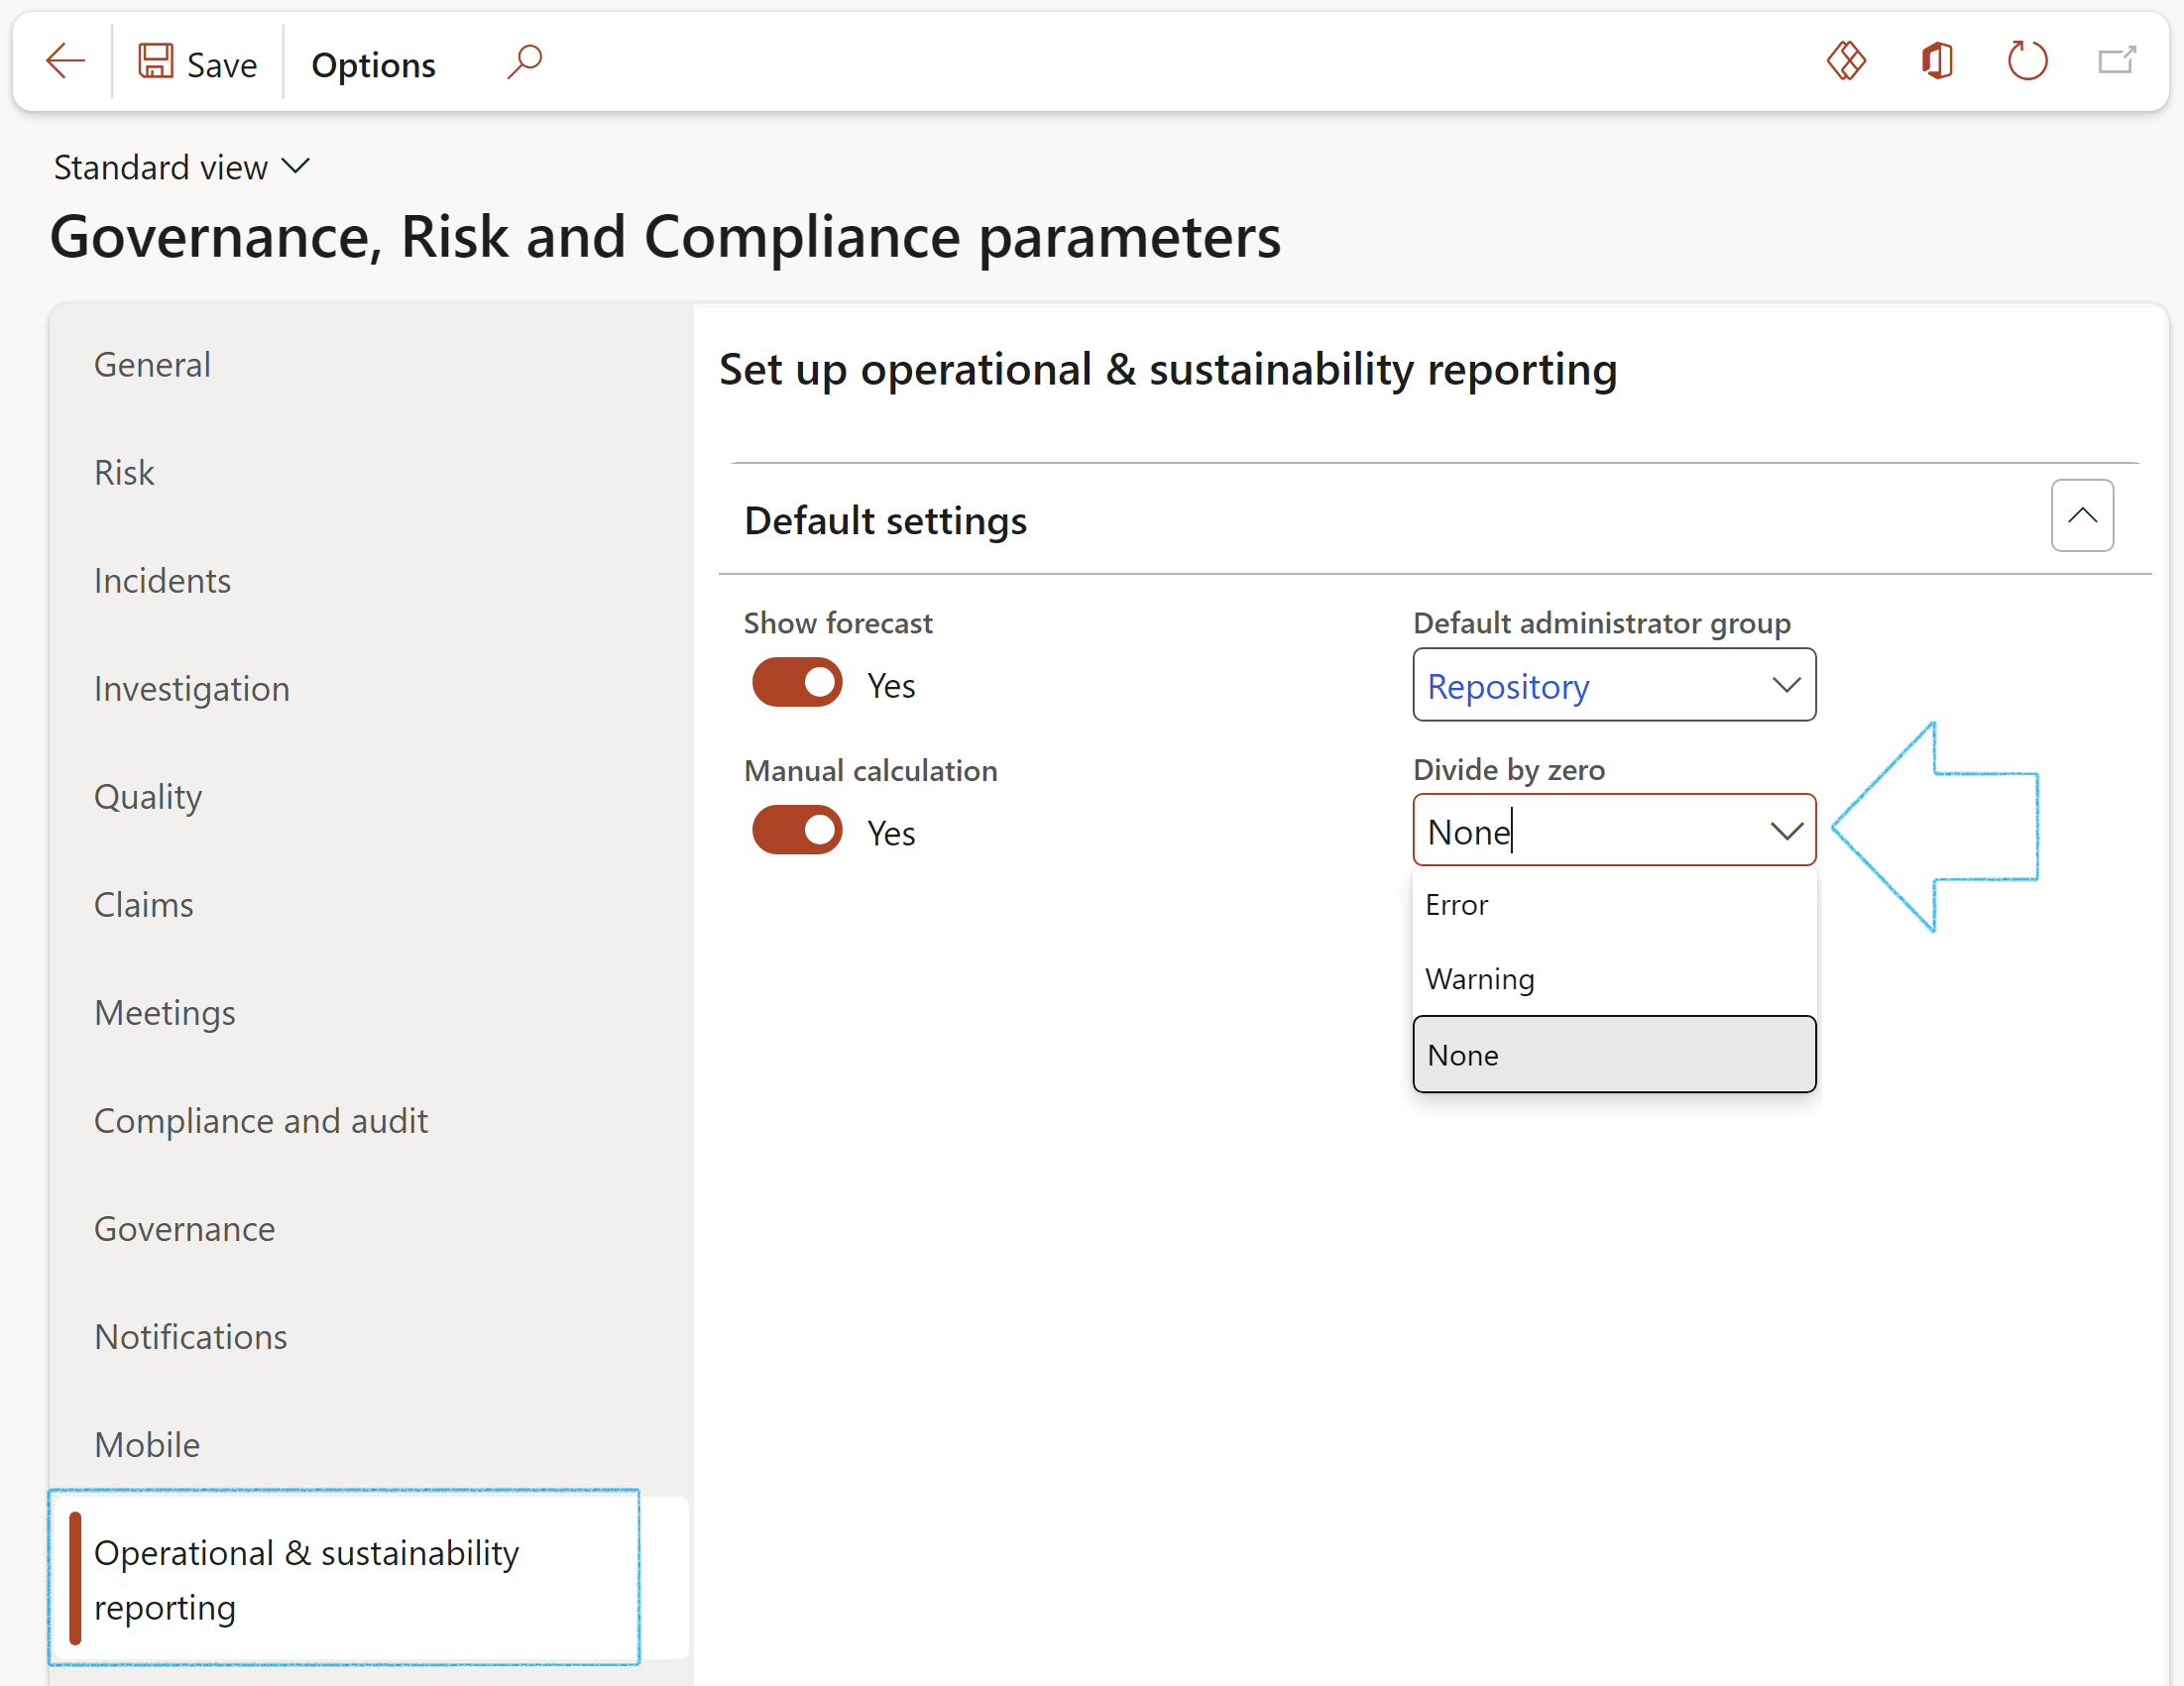
¶ Step 6: Set up Operational & sustainability reporting Parameters
Go to: GRC > Setup & Governance, Risk and Compliance parameters
- Under the Operational & sustainability reporting tab, expand the Default settings Fast tab
- The Show forecast slider:
- If this slider is set to Yes, the forecast information will be visible on the Reporting data and My reporting data forms.
- If the slider is set to No, the forecast information will be hidden on the Reporting data and My reporting data forms.
- The Manual calculation slider:
- If this slider is set to Yes, the calculations will not be done automatically when data is entered. The user will have to click the Calculate button on the Reporting data and My reporting data forms. There is also a Reporting data calculation batch job that can be set to run regularly to update the calculations automatically in the background. Go to: GRC > Operational & sustainability reporting > Periodic > Reporting data calculation
- If the slider is set to No, the calculations will automatically be done when the user enters data on the Reporting data and My reporting data forms. This might impact the response on these forms.
- In the Default administrator group field, select the Repository administrator user group from the dropdown list
- In the Divide by zero field, the user can choose one of the following as the default setting for handling a divide by zero calculation error:
- Error: will stop the program and show an error message to the user, who will have to fix the values before continuing.
- Warning: will replace the calculated value by zero and display a warning message to the user, who can continue.
- None: will replace the calculated value by zero without any message to the user.
- Once a repository is created from a template, the template will be locked and cannot be changed.
- Users belonging to this user group will still be able to make changes to locked reporting templates. E.g. they will be able to change a calculation expression etc.
- When a new repository is created, the selected user group will default as the Repository administrator user group on the Data repository.
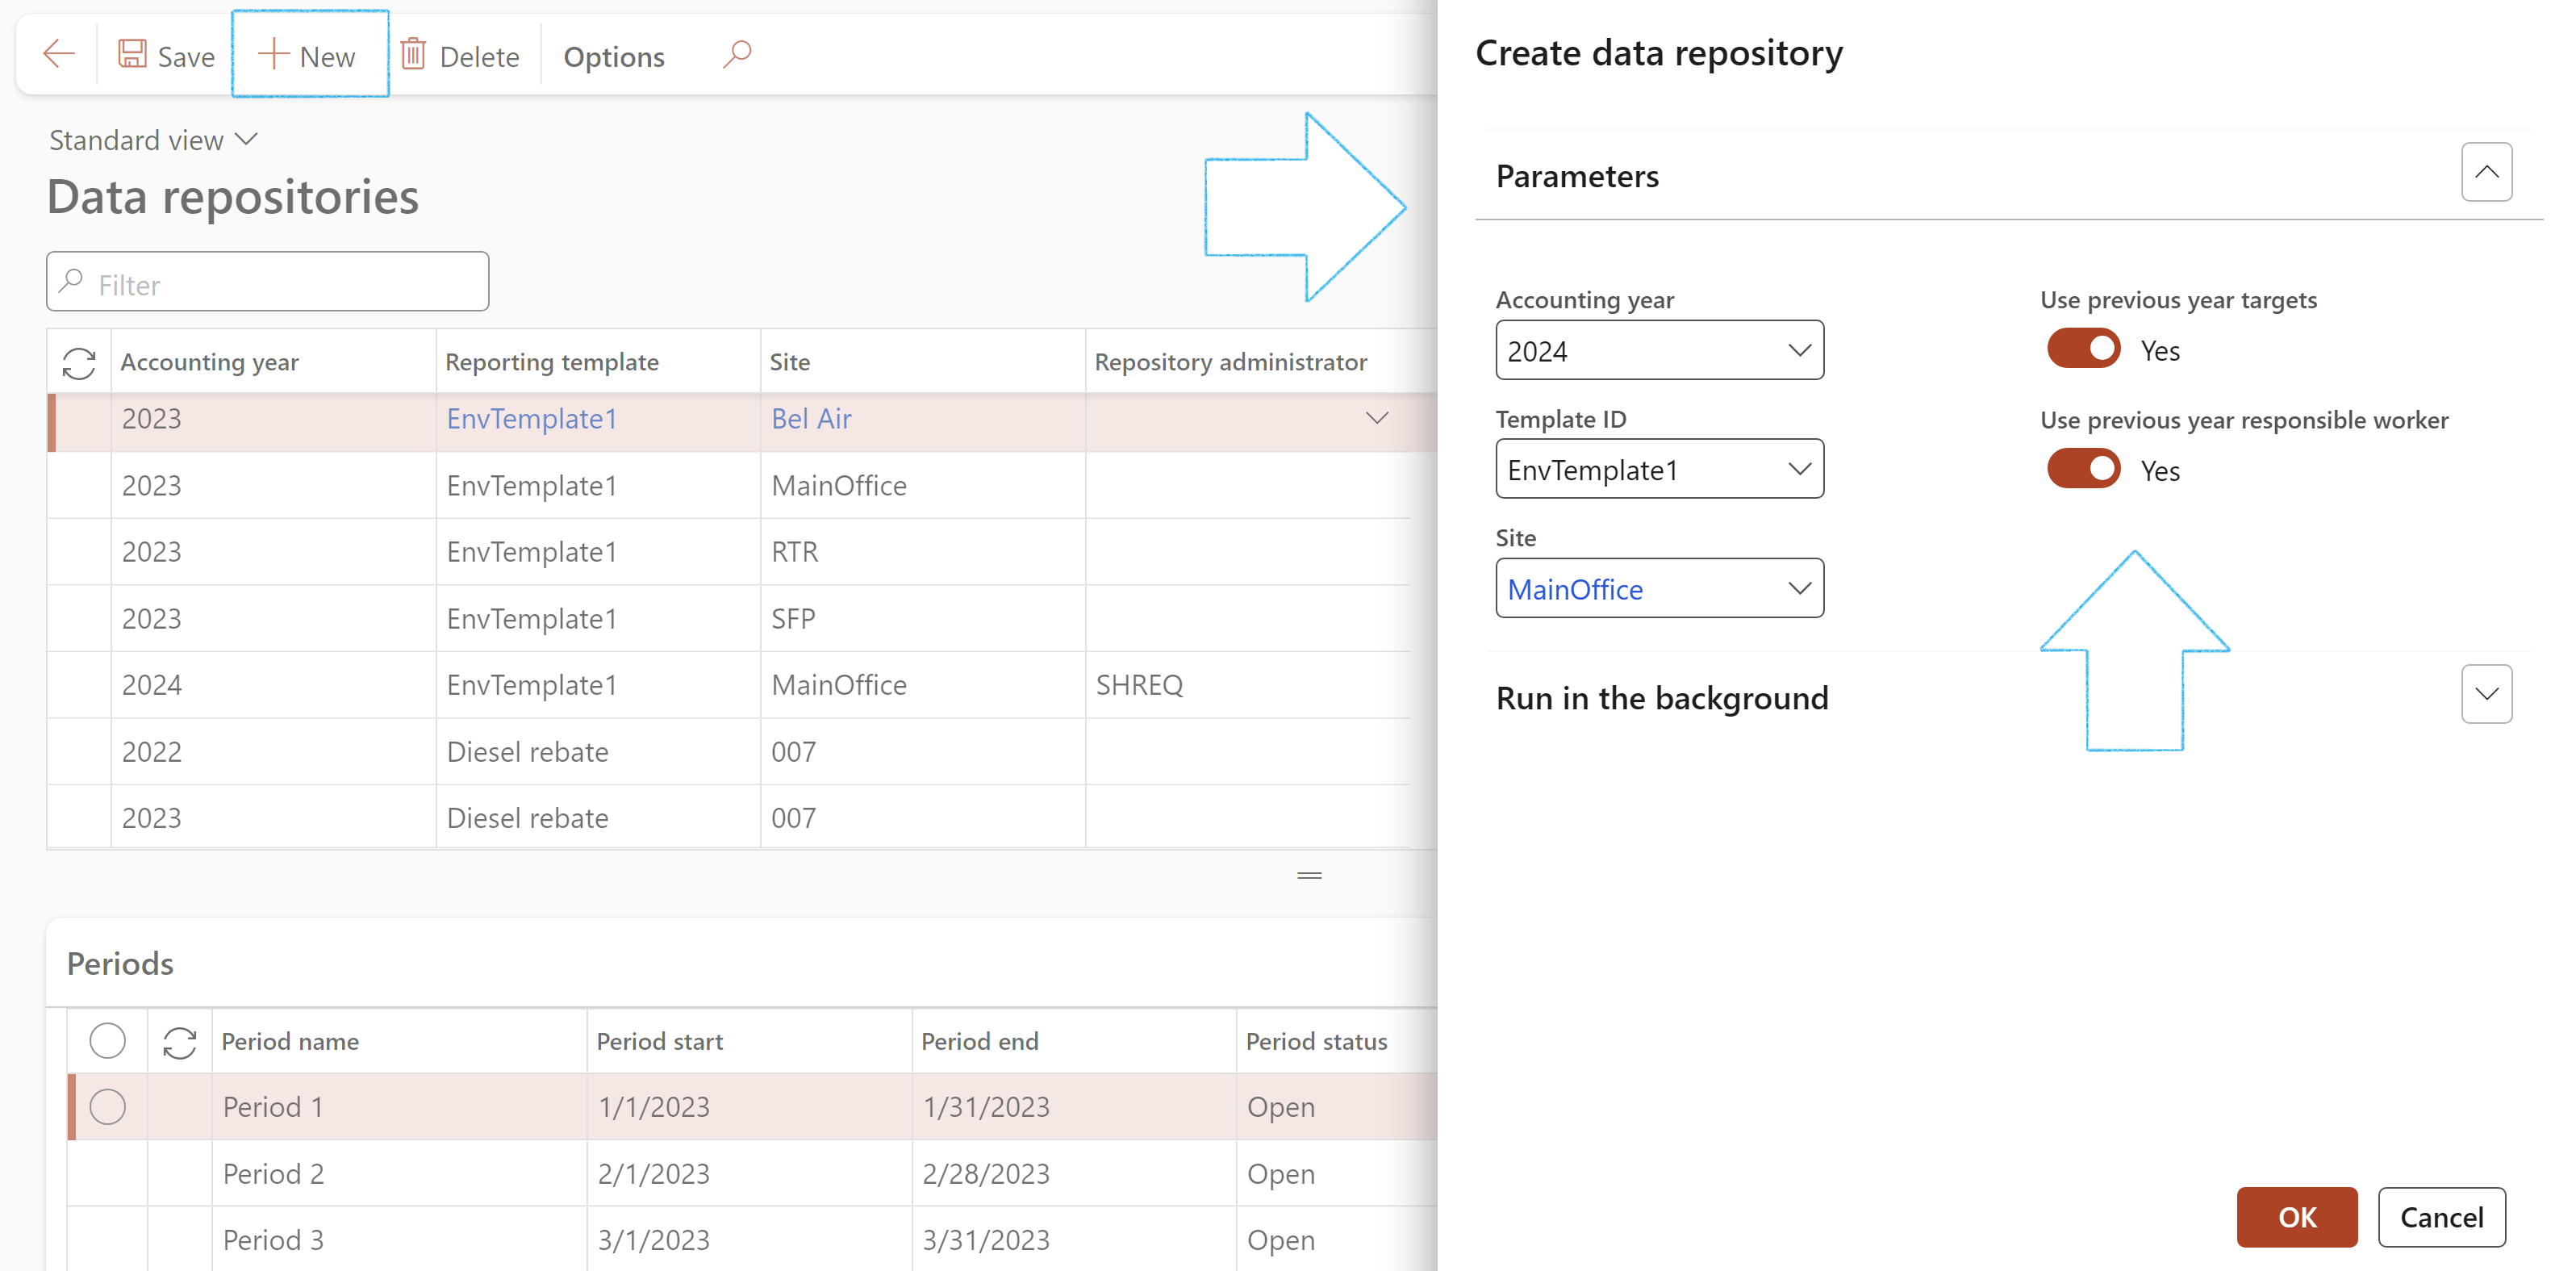
- On the Action pane, click on the New button
- On the Create data repository dialog:
- Select the relevant Accounting year (Setup under: GRC > Operational & sustainability reporting > Setup for Operational & sustainability reporting > Financial calendars)
- Select the relevant Template ID from the dropdown list (Only Reporting templates with status Approved will be available for selection)
- Select the relevant Site from the dropdown list
- Move the Use previous year targets slider to Yes if you want to copy the targets from the previous fiscal year to the new repository
- Move the Use previous year responsible worker slider to Yes if you want to copy the responsible worker setup on the previous fiscal year to the new repository
- Click on OK
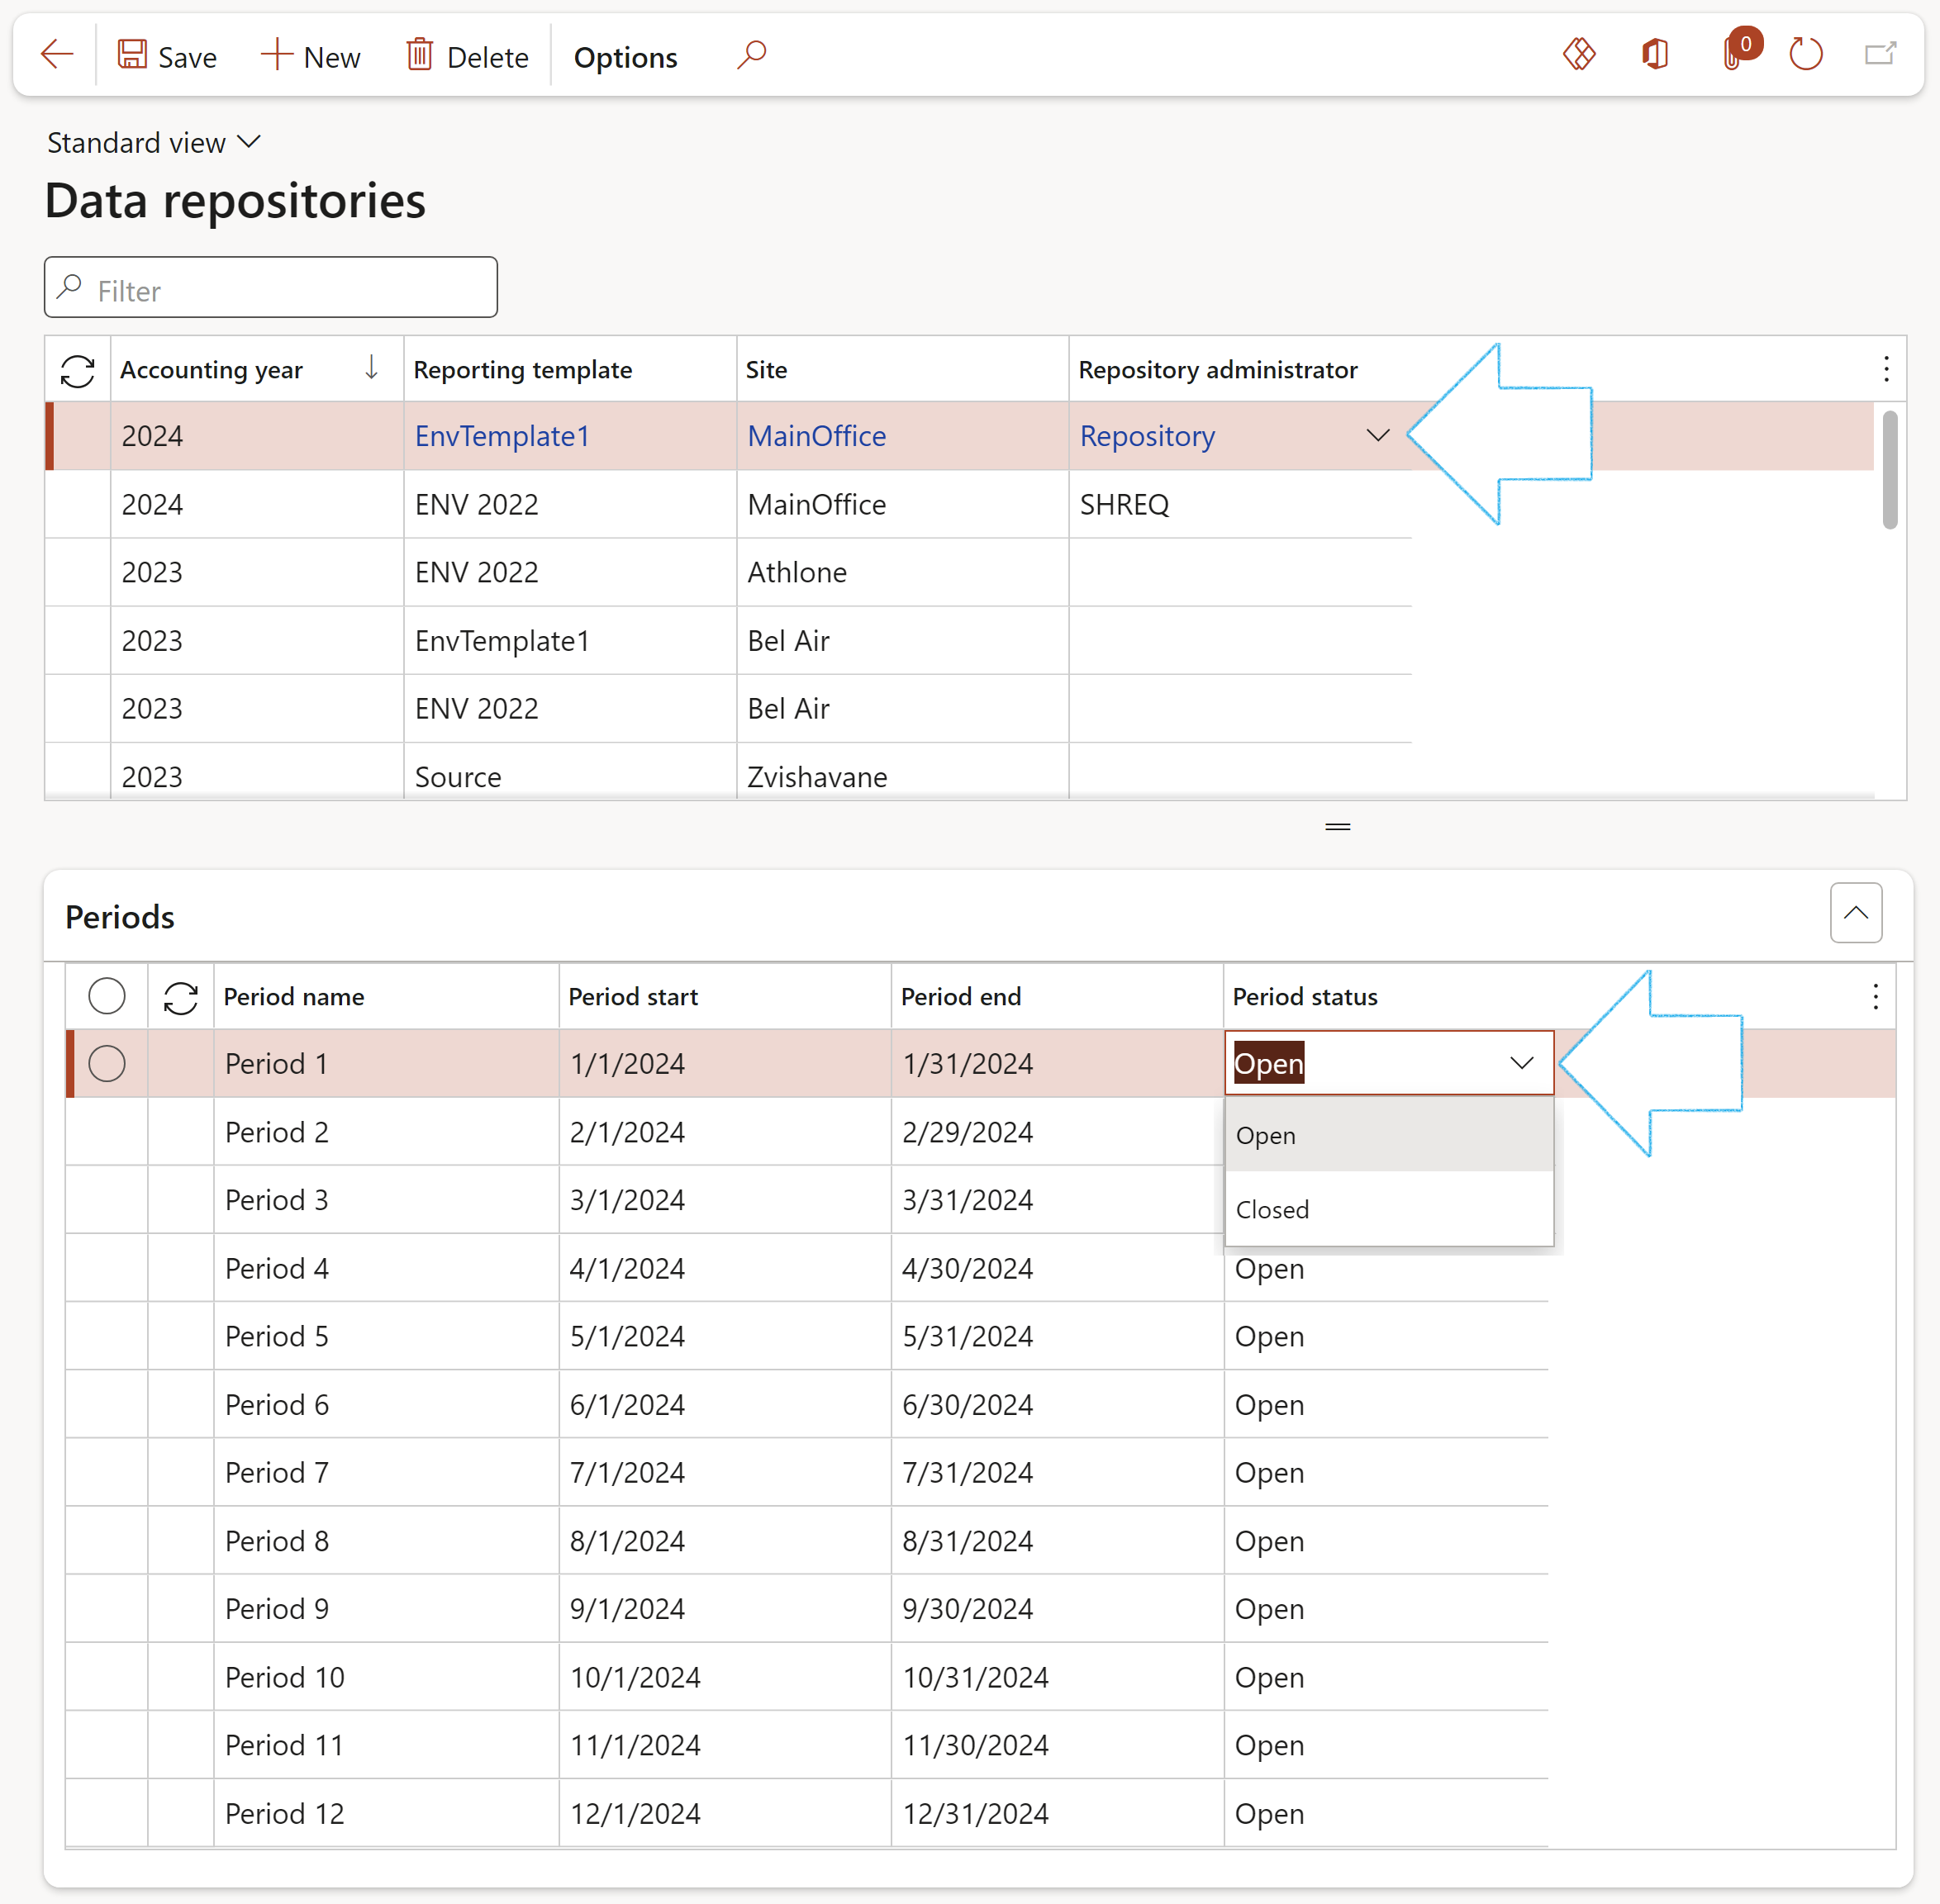
- On the Data repositories form, select the record that you have just created
- In the Repository administrator field, select the Administrator group that was created under Step 5
- When a period is open, users can make changes to the data
- Only users that belong to the selected Repository administrator user group can change the Period status
- Only users that belong to the selected Repository administrator user group can edit the data in the repository when the period is closed
- A Data repository record can only be deleted if all the actual values on the Reporting data lines are 0
- On the left-hand side, use the filters to display the required data
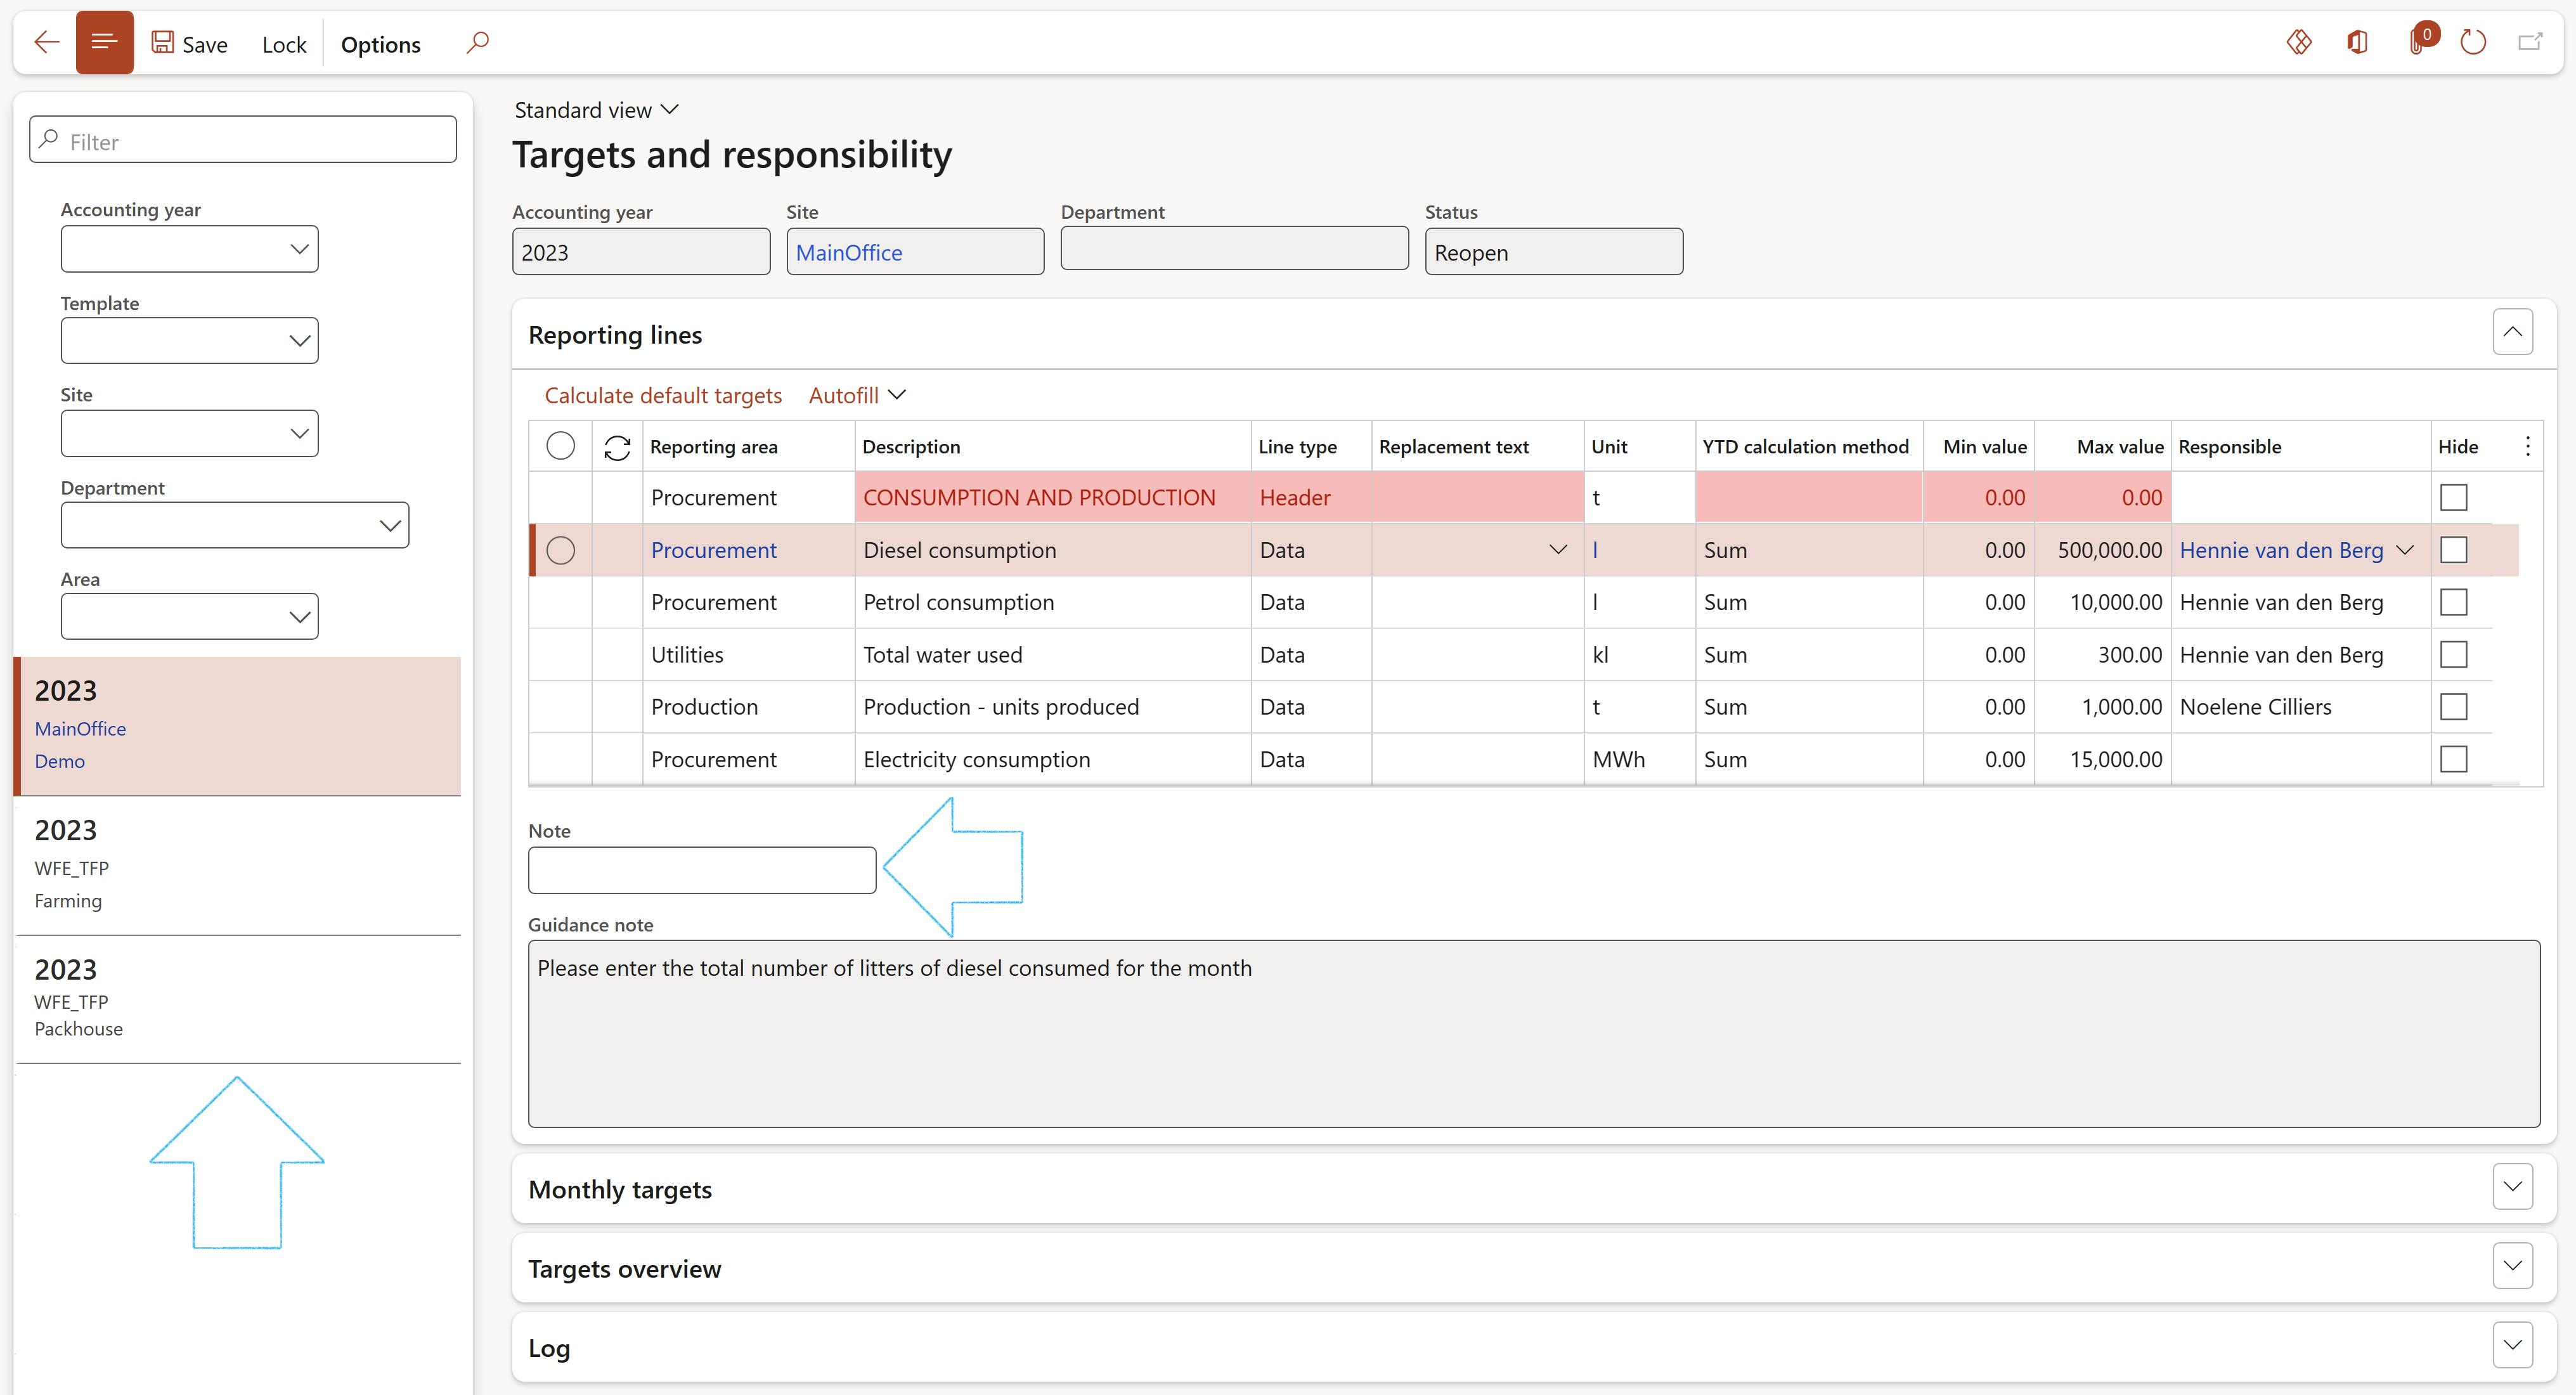
- Under the Reporting lines Fast tab, select the relevant record
- Set the monthly targets for the selected line under the Monthly targets Fast tab
- The user can also make use of the Autofill button to enter or overwrite all 12 months target values for the selected line. (The Autofill button is not available for Header type lines)
- Enter the Minimum value for the reporting area
- Enter the Maximum value for the reporting area
- Select the person Responsible for the reporting area
- Tick the box in the Hide column if the record is not applicable for the selected site
- A Note can be entered for each line
- On the left-hand side, use the filters to display the required data
- Select the Template that you want to display the data for
- Select the Site that you want to display the data for
- Select the Department that you want to display the data for
- Select the Accounting year that you want to display the data for
- Select the Month that you want to display the data for
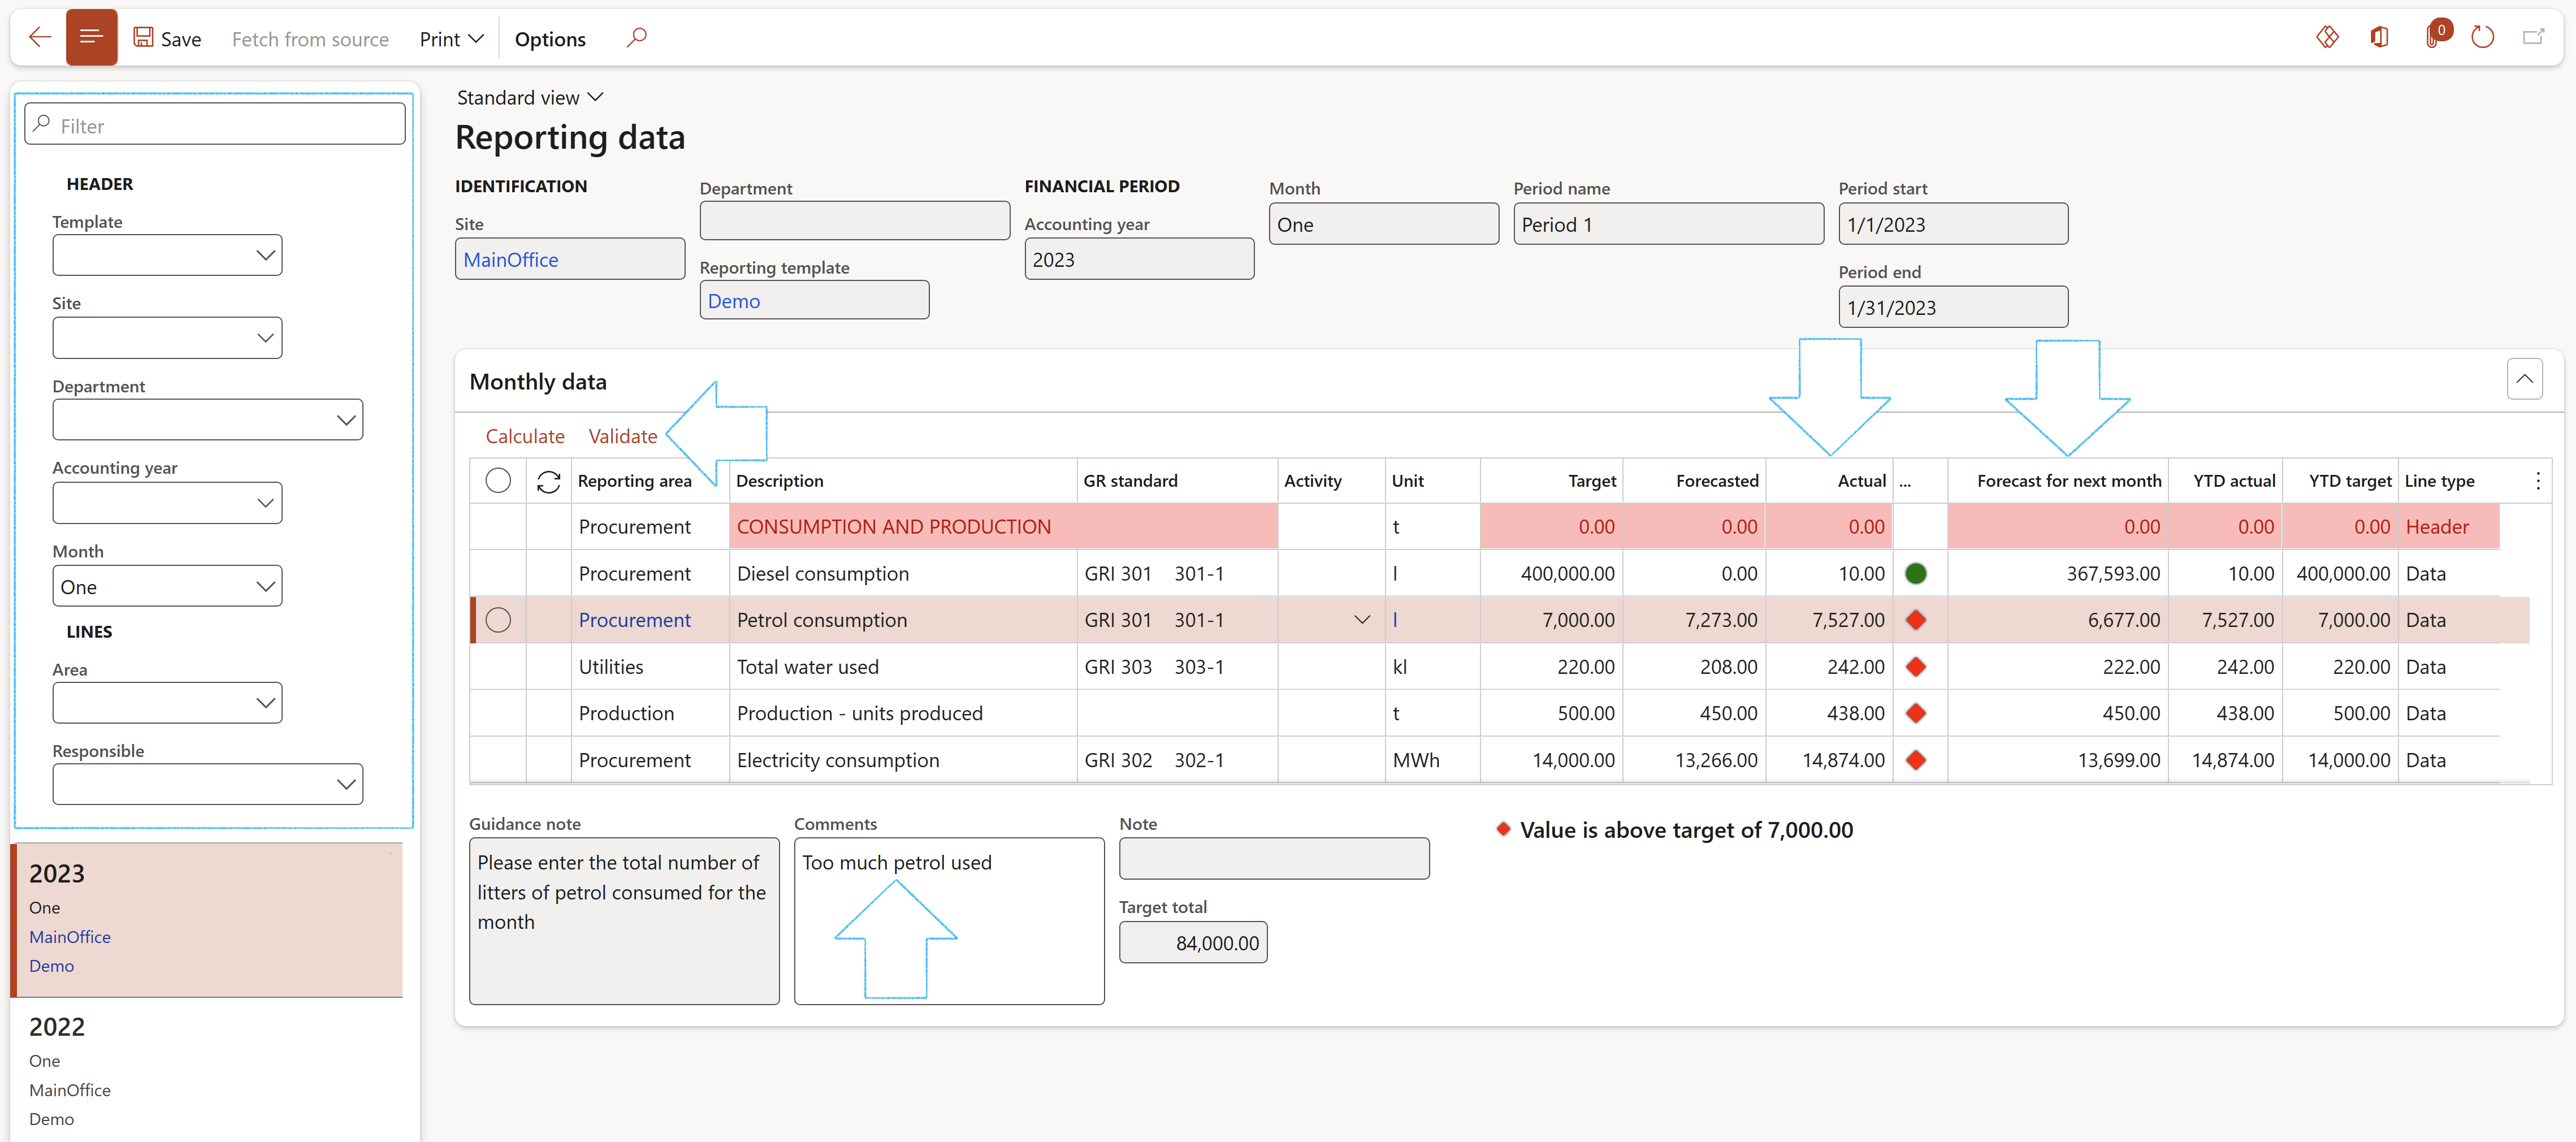
- Under the Monthly data Fast tab:
- The Actual field can be edited
- The Forecast for next month field can be edited
- Comments can be entered for the selected line
- The Calculate button: The system will calculate the actual line value by using the formula specified on the template
- The Validate button: The system will do checks on the minimum and maximum values entered
- To view the Year to date and Quarterly info for the selected line, expand the Related information pane
- Select the relevant information for the report that you want to run on the Monthly report dialog
- Click OK
- Use the filters to select the data that you want to display
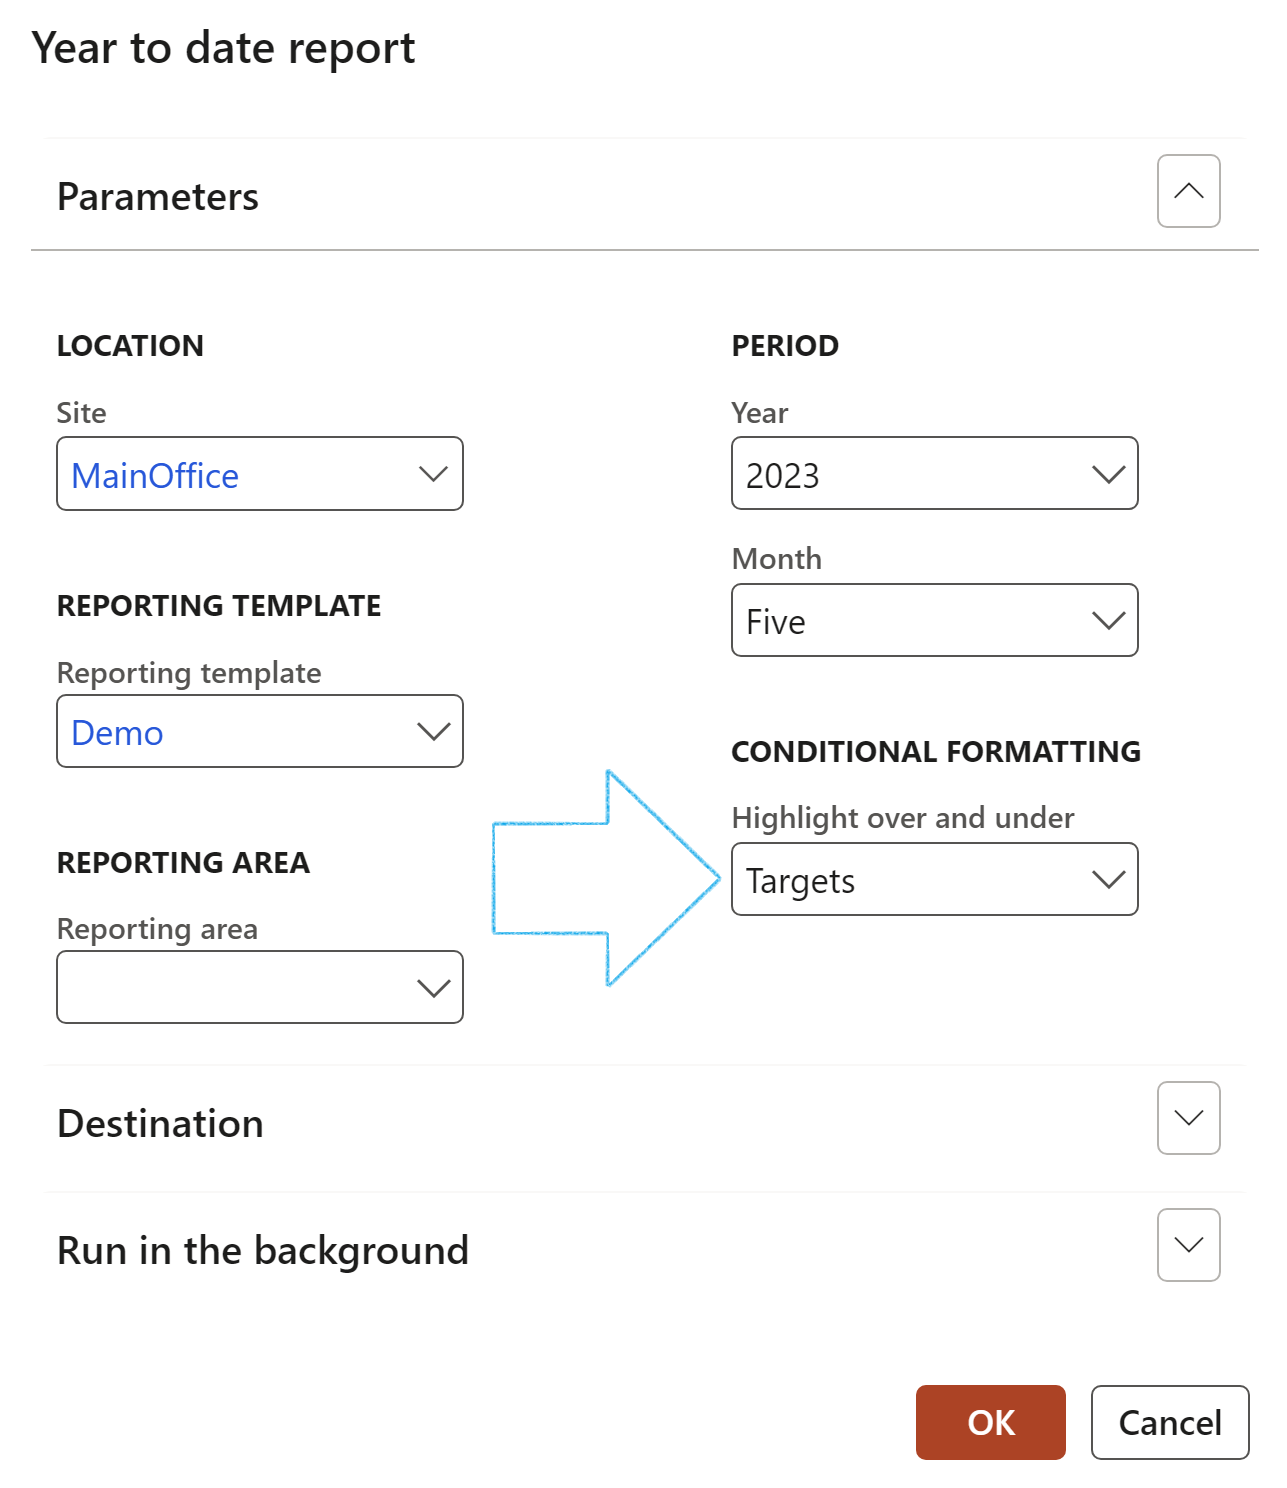
- Select the relevant information for the report that you want to run on the Year to date report dialog
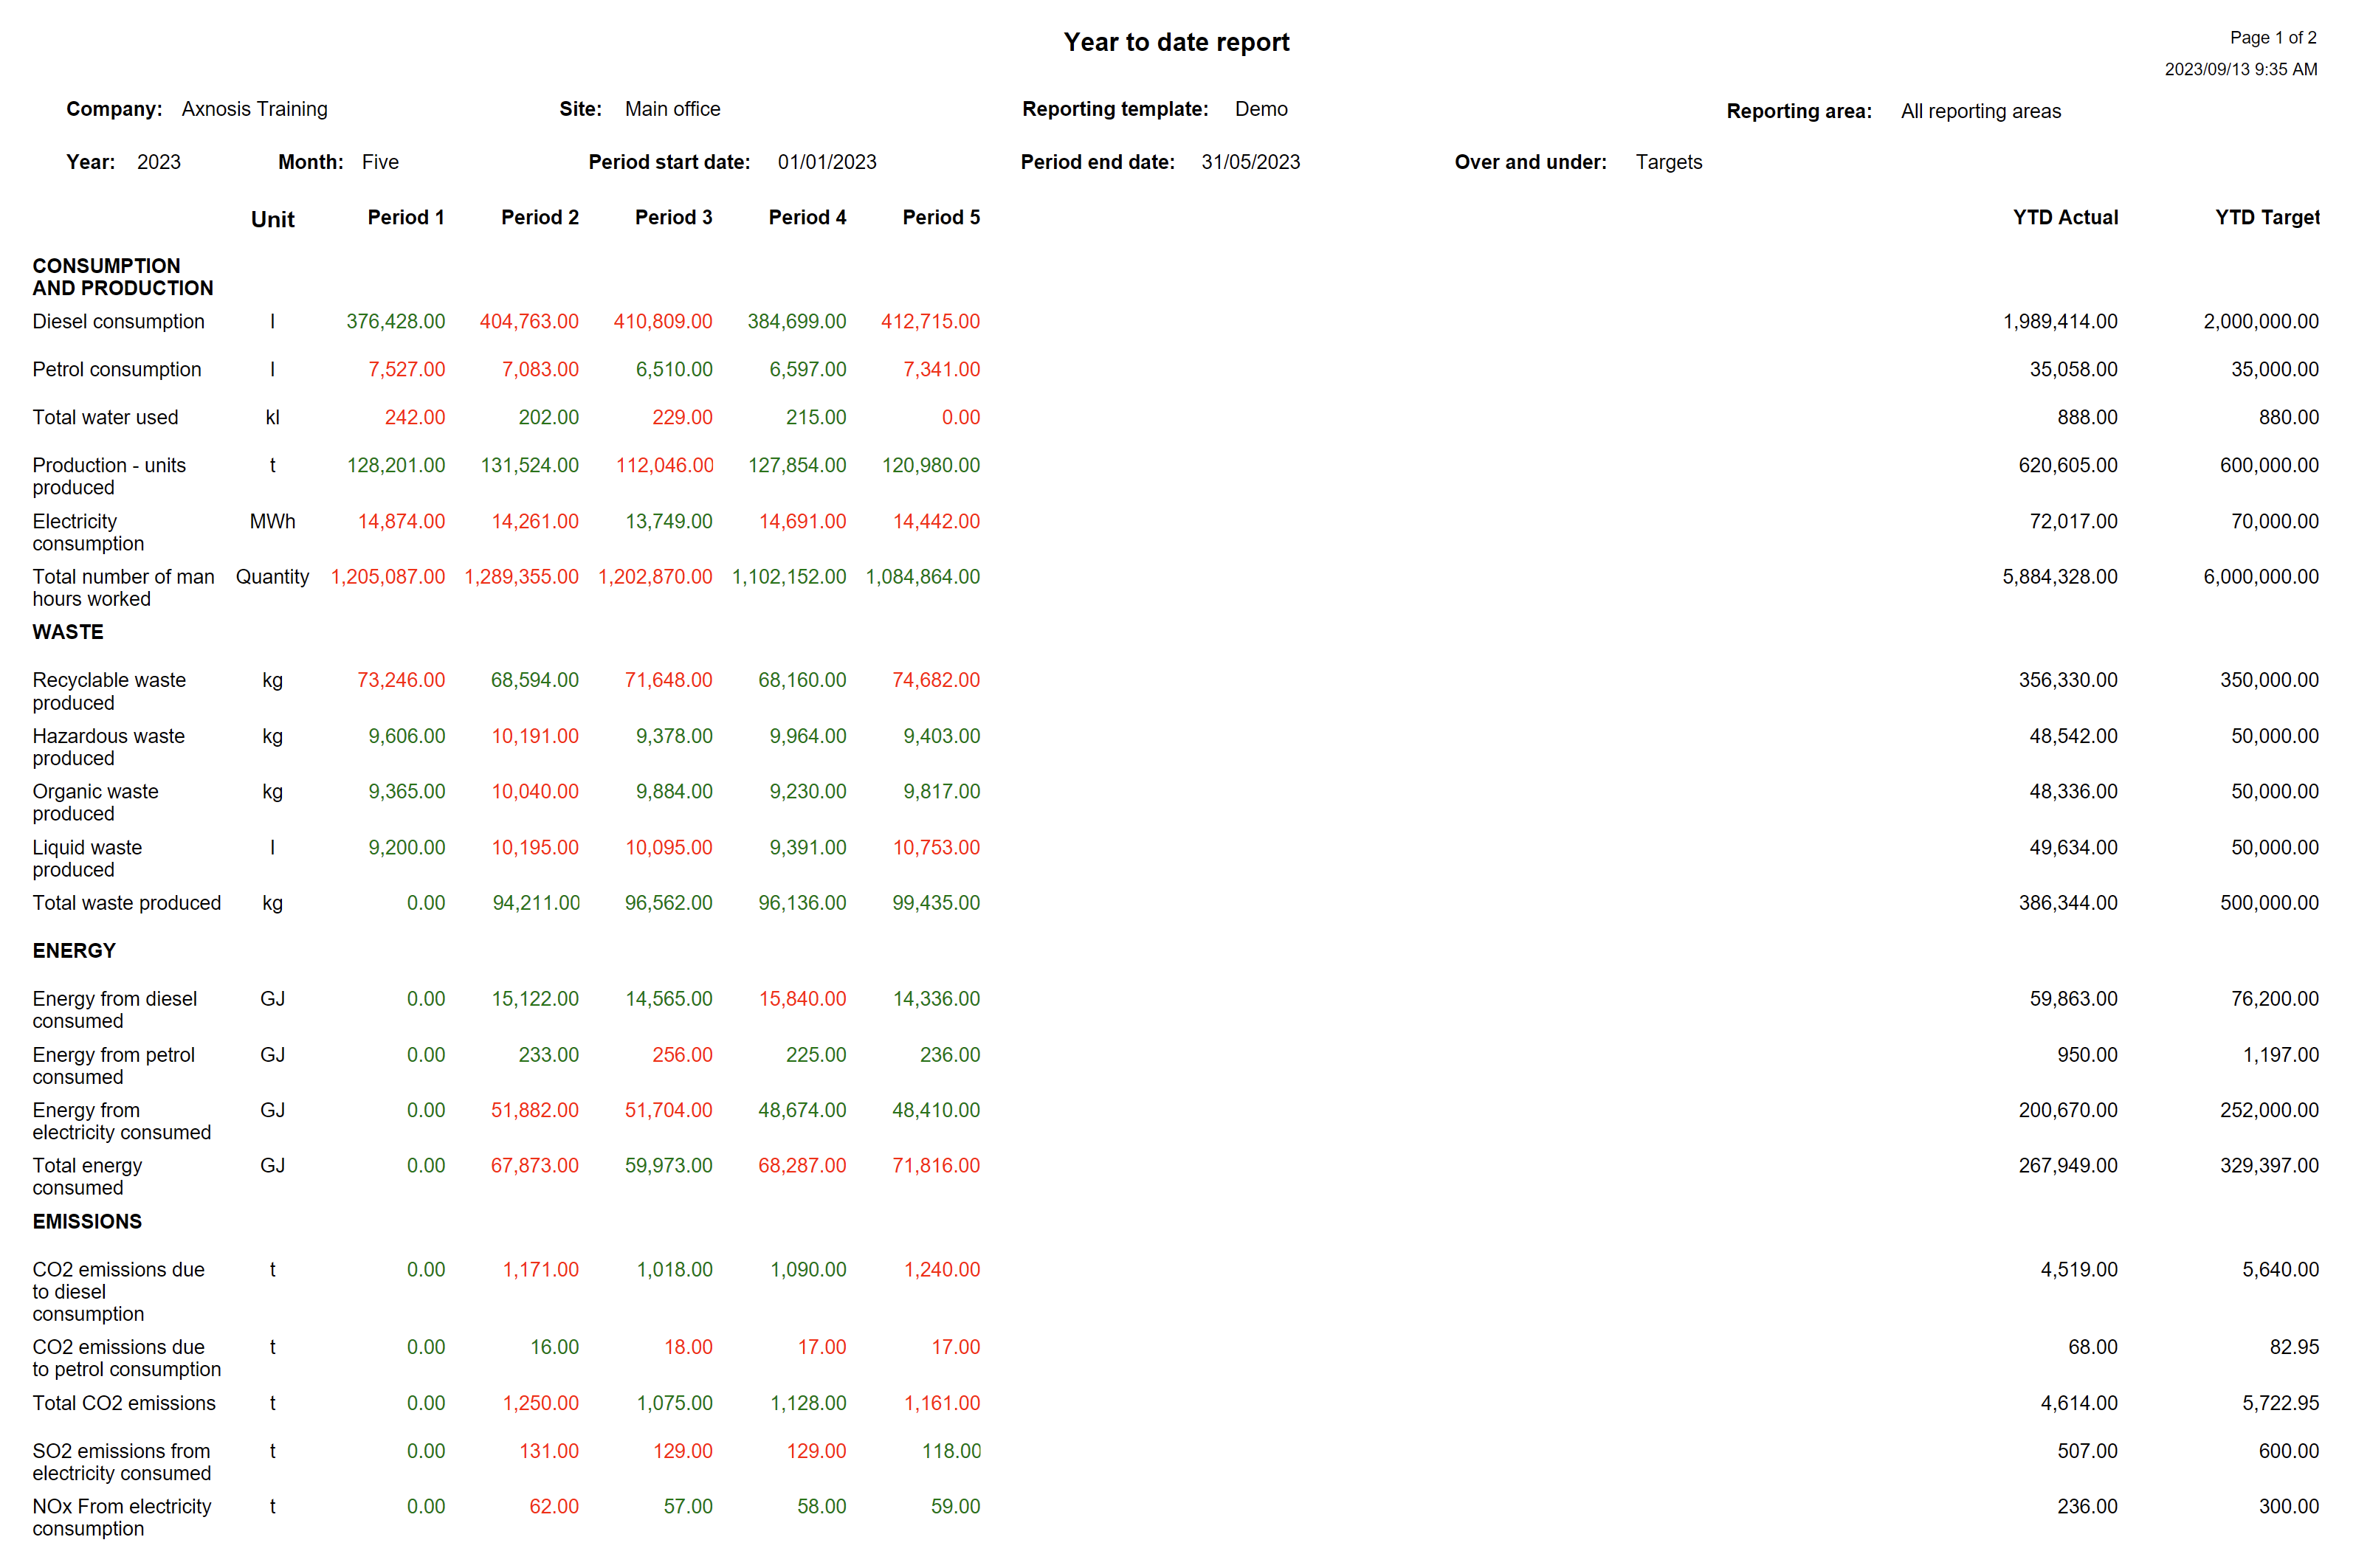
- In the Highlight over and under field, the user can choose to have the Min/Max values, of the Target values highlighted on the report
- Click OK
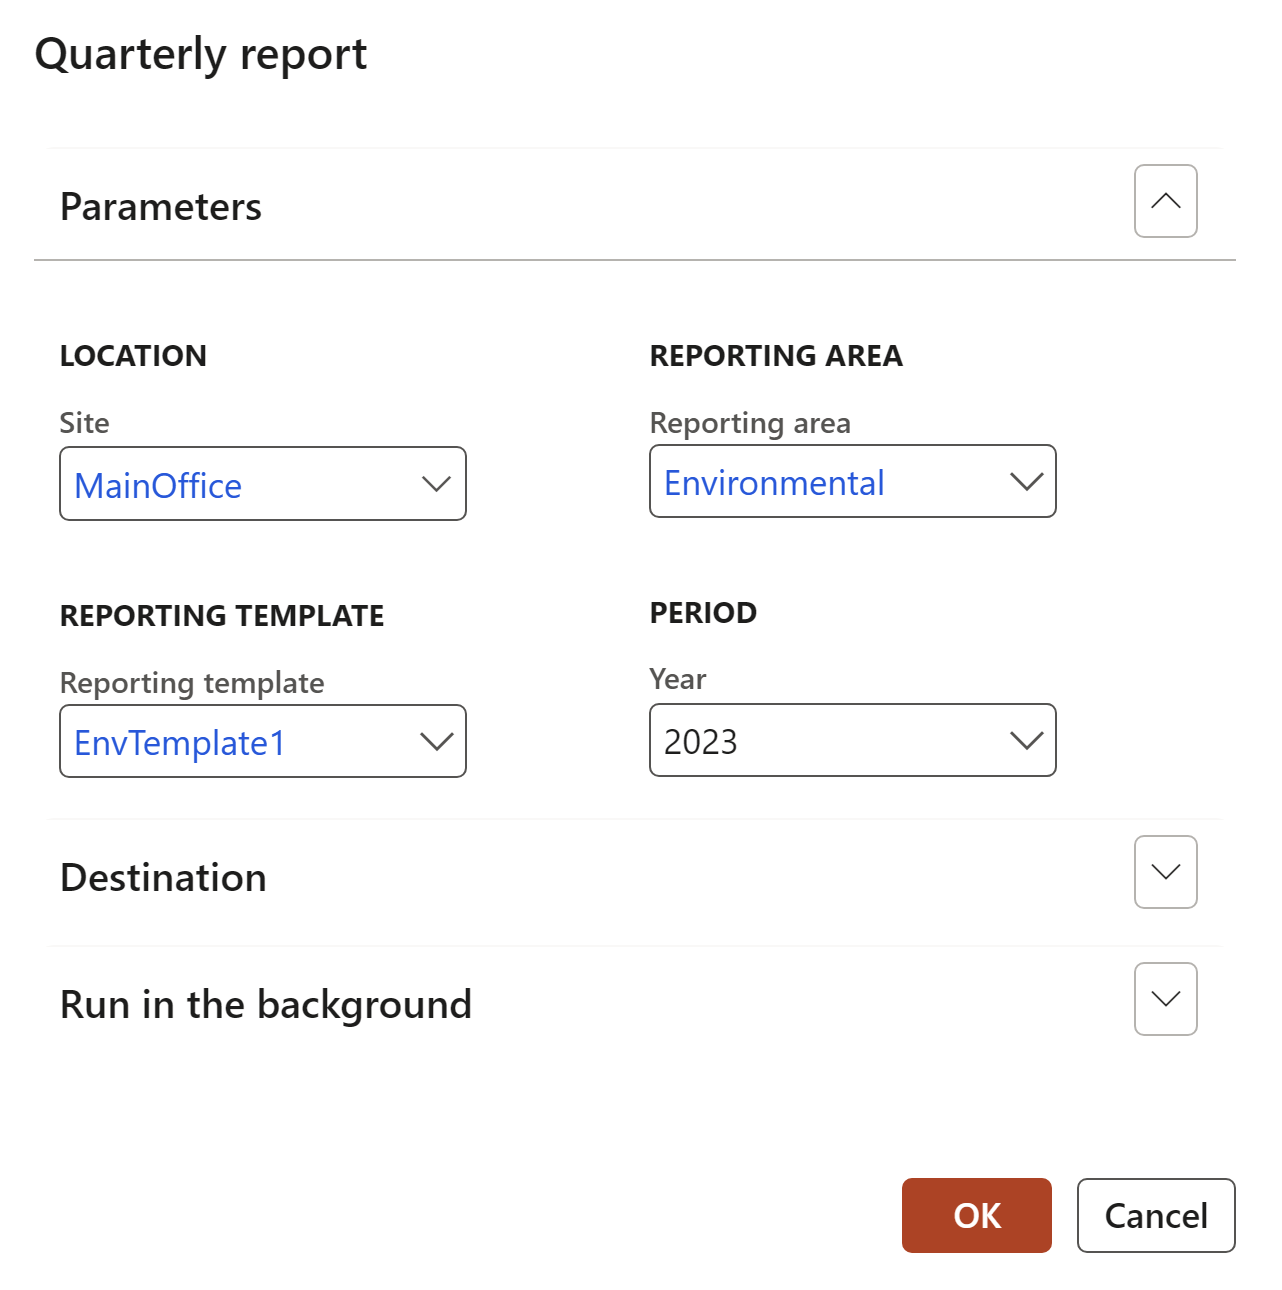
- Select the relevant information for the report that you want to run on the Quarterly report dialog
- Click OK
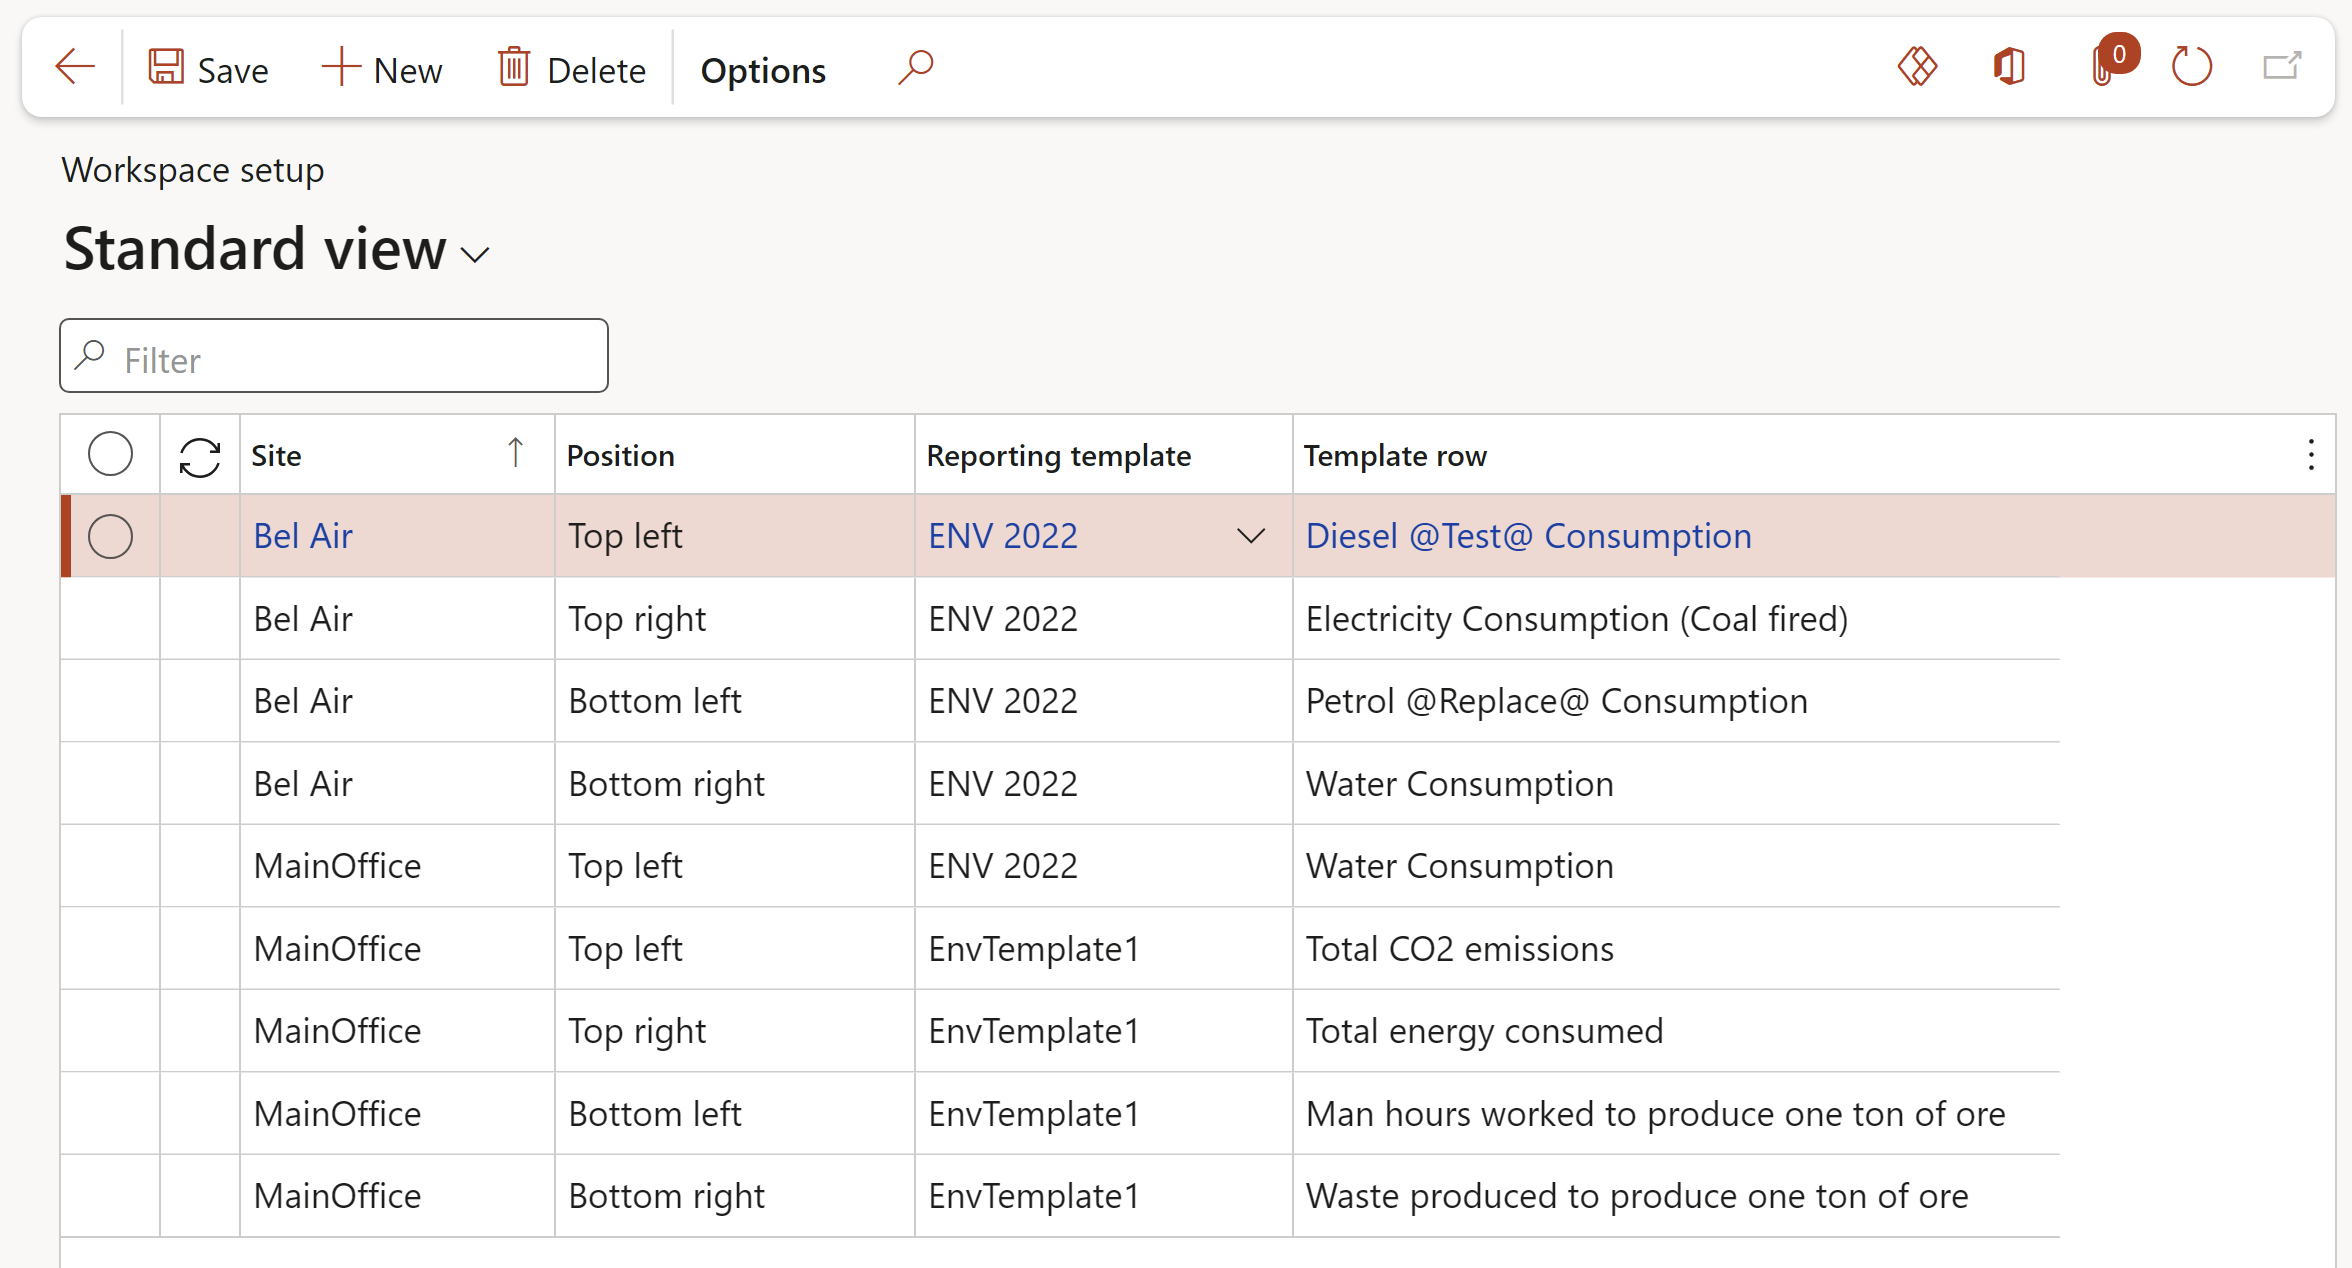
- In the Action pane, click on the New button
- Select the Site for which you want the data to be displayed, from the dropdown list
- Select the Position where on the workspace where the graph should be displayed, from the dropdown list
- Select the Reporting template for which the data should be displayed, from the dropdown list
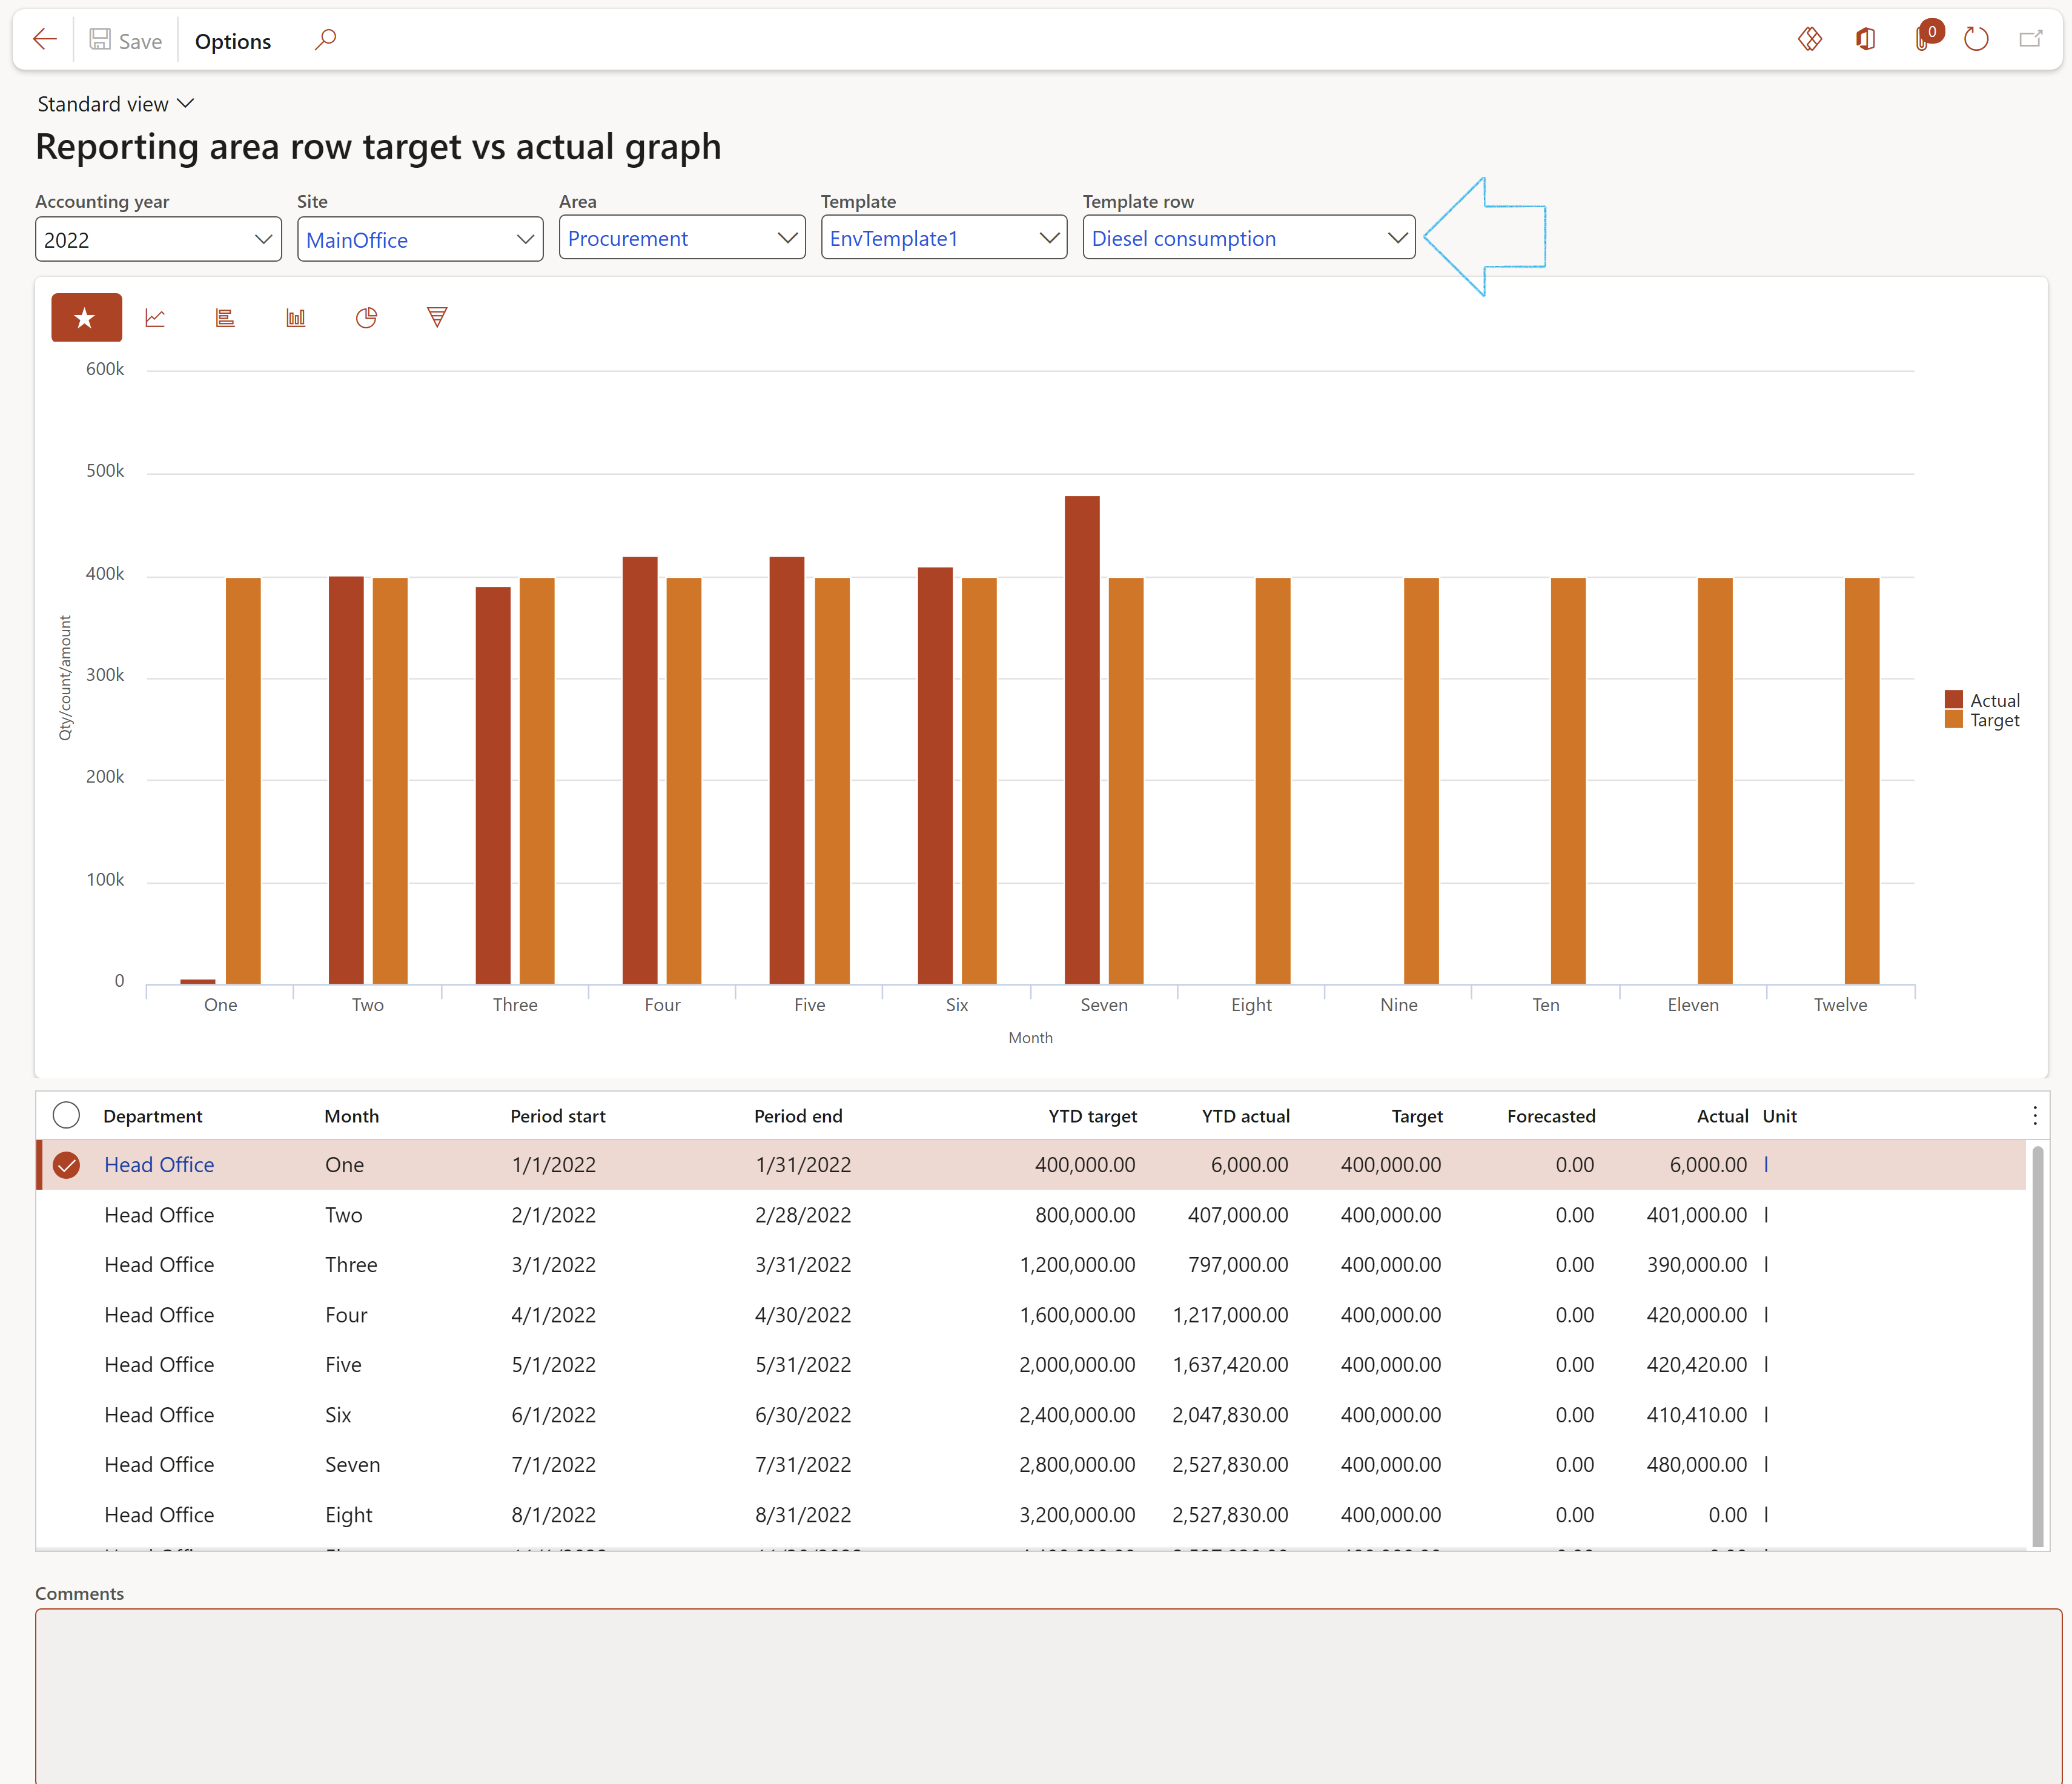
- Select the Template row for which the data should be displayed, from the dropdown list
- Use the filters to select the data that you want to display
- Replacement list: ‘Replacement placeholders’ Target entity: ‘OHSReportingReplacementPlaceholderEntity’
- Replacement data: ‘Replacement data' Target entity: ‘OHSReportingReplacementDataEntity’
- Attribute value: ‘Instance value for replacement data’ Target entity: ‘OHSReportingReplacementInstanceValueEntity’
- User groups Target entity: ‘SystemUserGroupEntity’
- User group user list Target entity: ‘SystemUserGroupUserListEntity’
- Data repository Target entity: ‘OHSReportingRepositoryEntity’
- Data repository lines Target entity: ‘OHSReportingRepositoryLinesEntity’
Please note:
¶ Periodic
¶ Step 7: Create Data repository
A repository for the new financial year can be created annually by using the Data repositories form
Go to: GRC > Operational & sustainability reporting > Periodic > Data repositories
This will make it easier to setup as it gives the user a starting point. The targets used in the previous year will be copied to the newly created repository. The targets can be updated using the Targets and responsibility form.
This will make it easier to setup as it gives the user a starting point. The responsible user used in the previous year will be copied to the newly created repository. The user can be updated if needed, using the Targets and responsibility form.
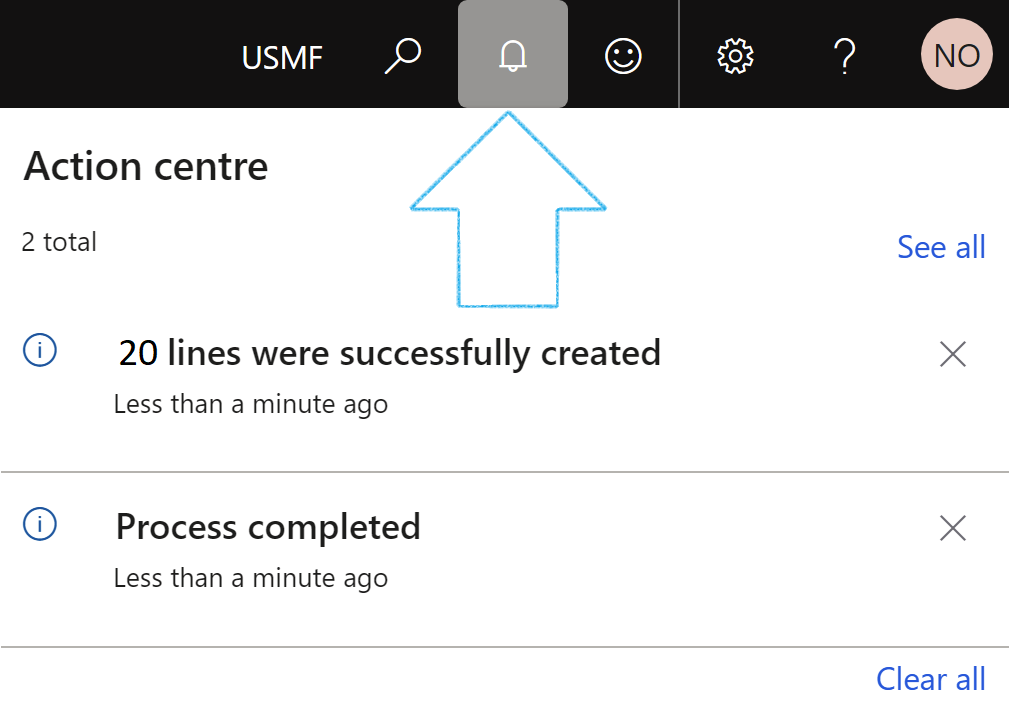
A message will pop up in the Action center to notify the user that a number of lines were created
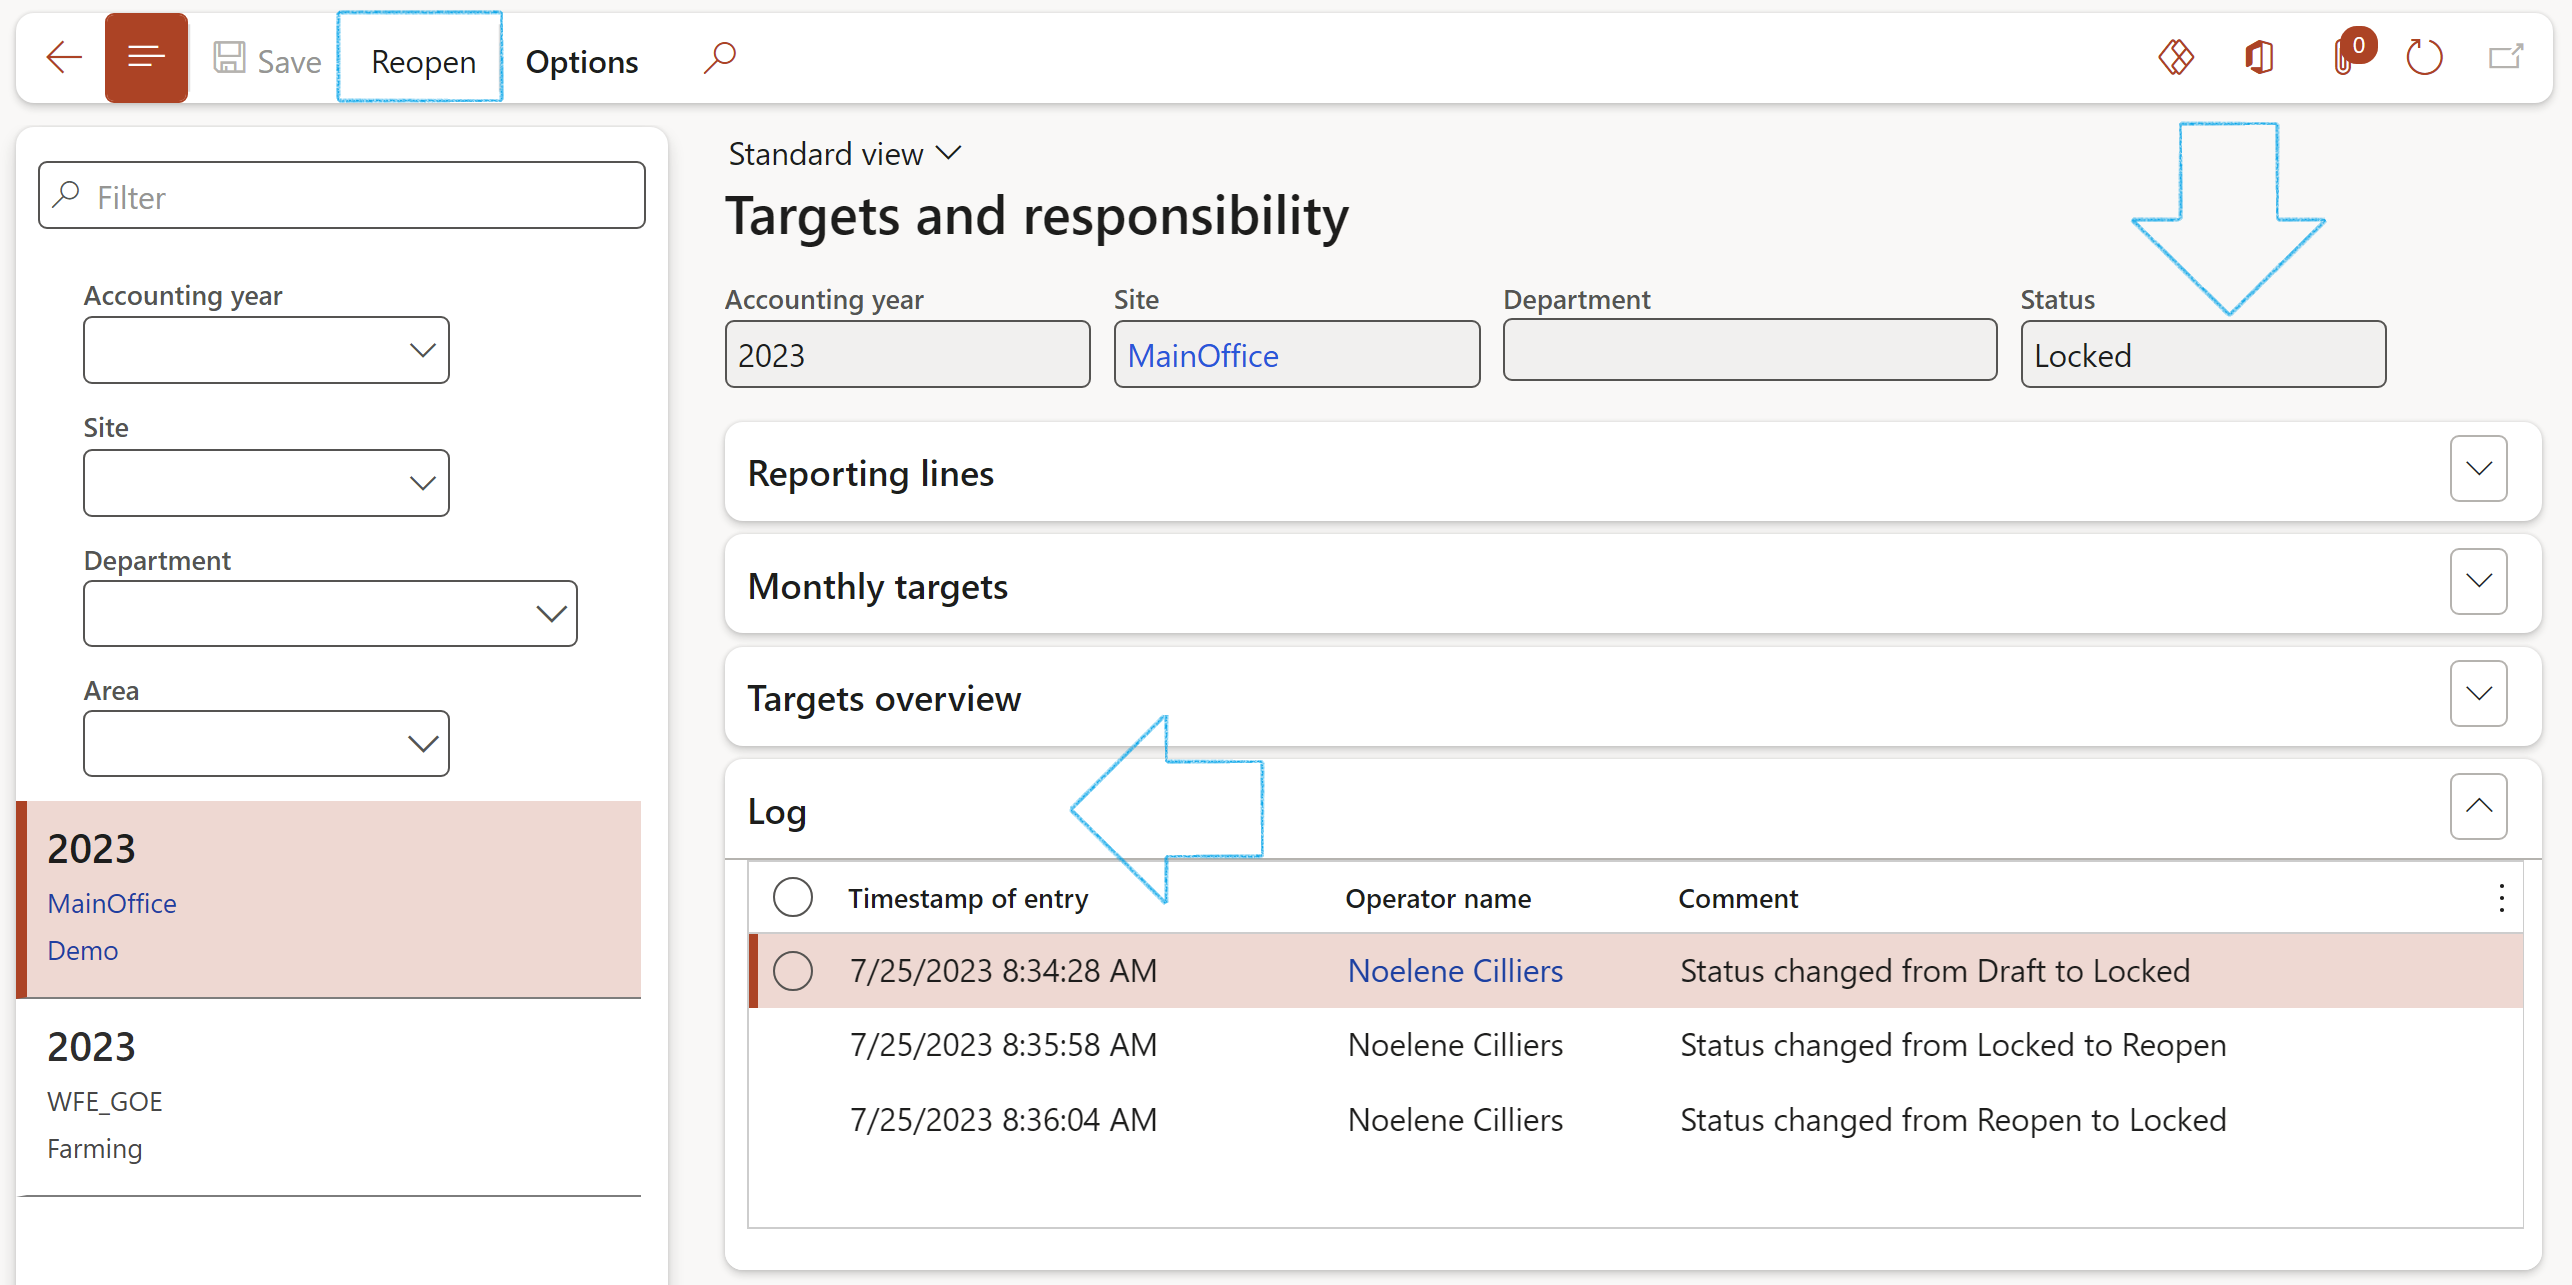
¶ Step 8: Set monthly targets and responsible users
This form is used to set targets for every line, accept header lines
Once the targets are set, the repository can be locked to stop additional changes. (It can be reopened by a user with the necessary security rights, if required)
A log of these activities is kept by the system.
Go to: GRC > Operational & sustainability reporting > Periodic > Targets and responsibility
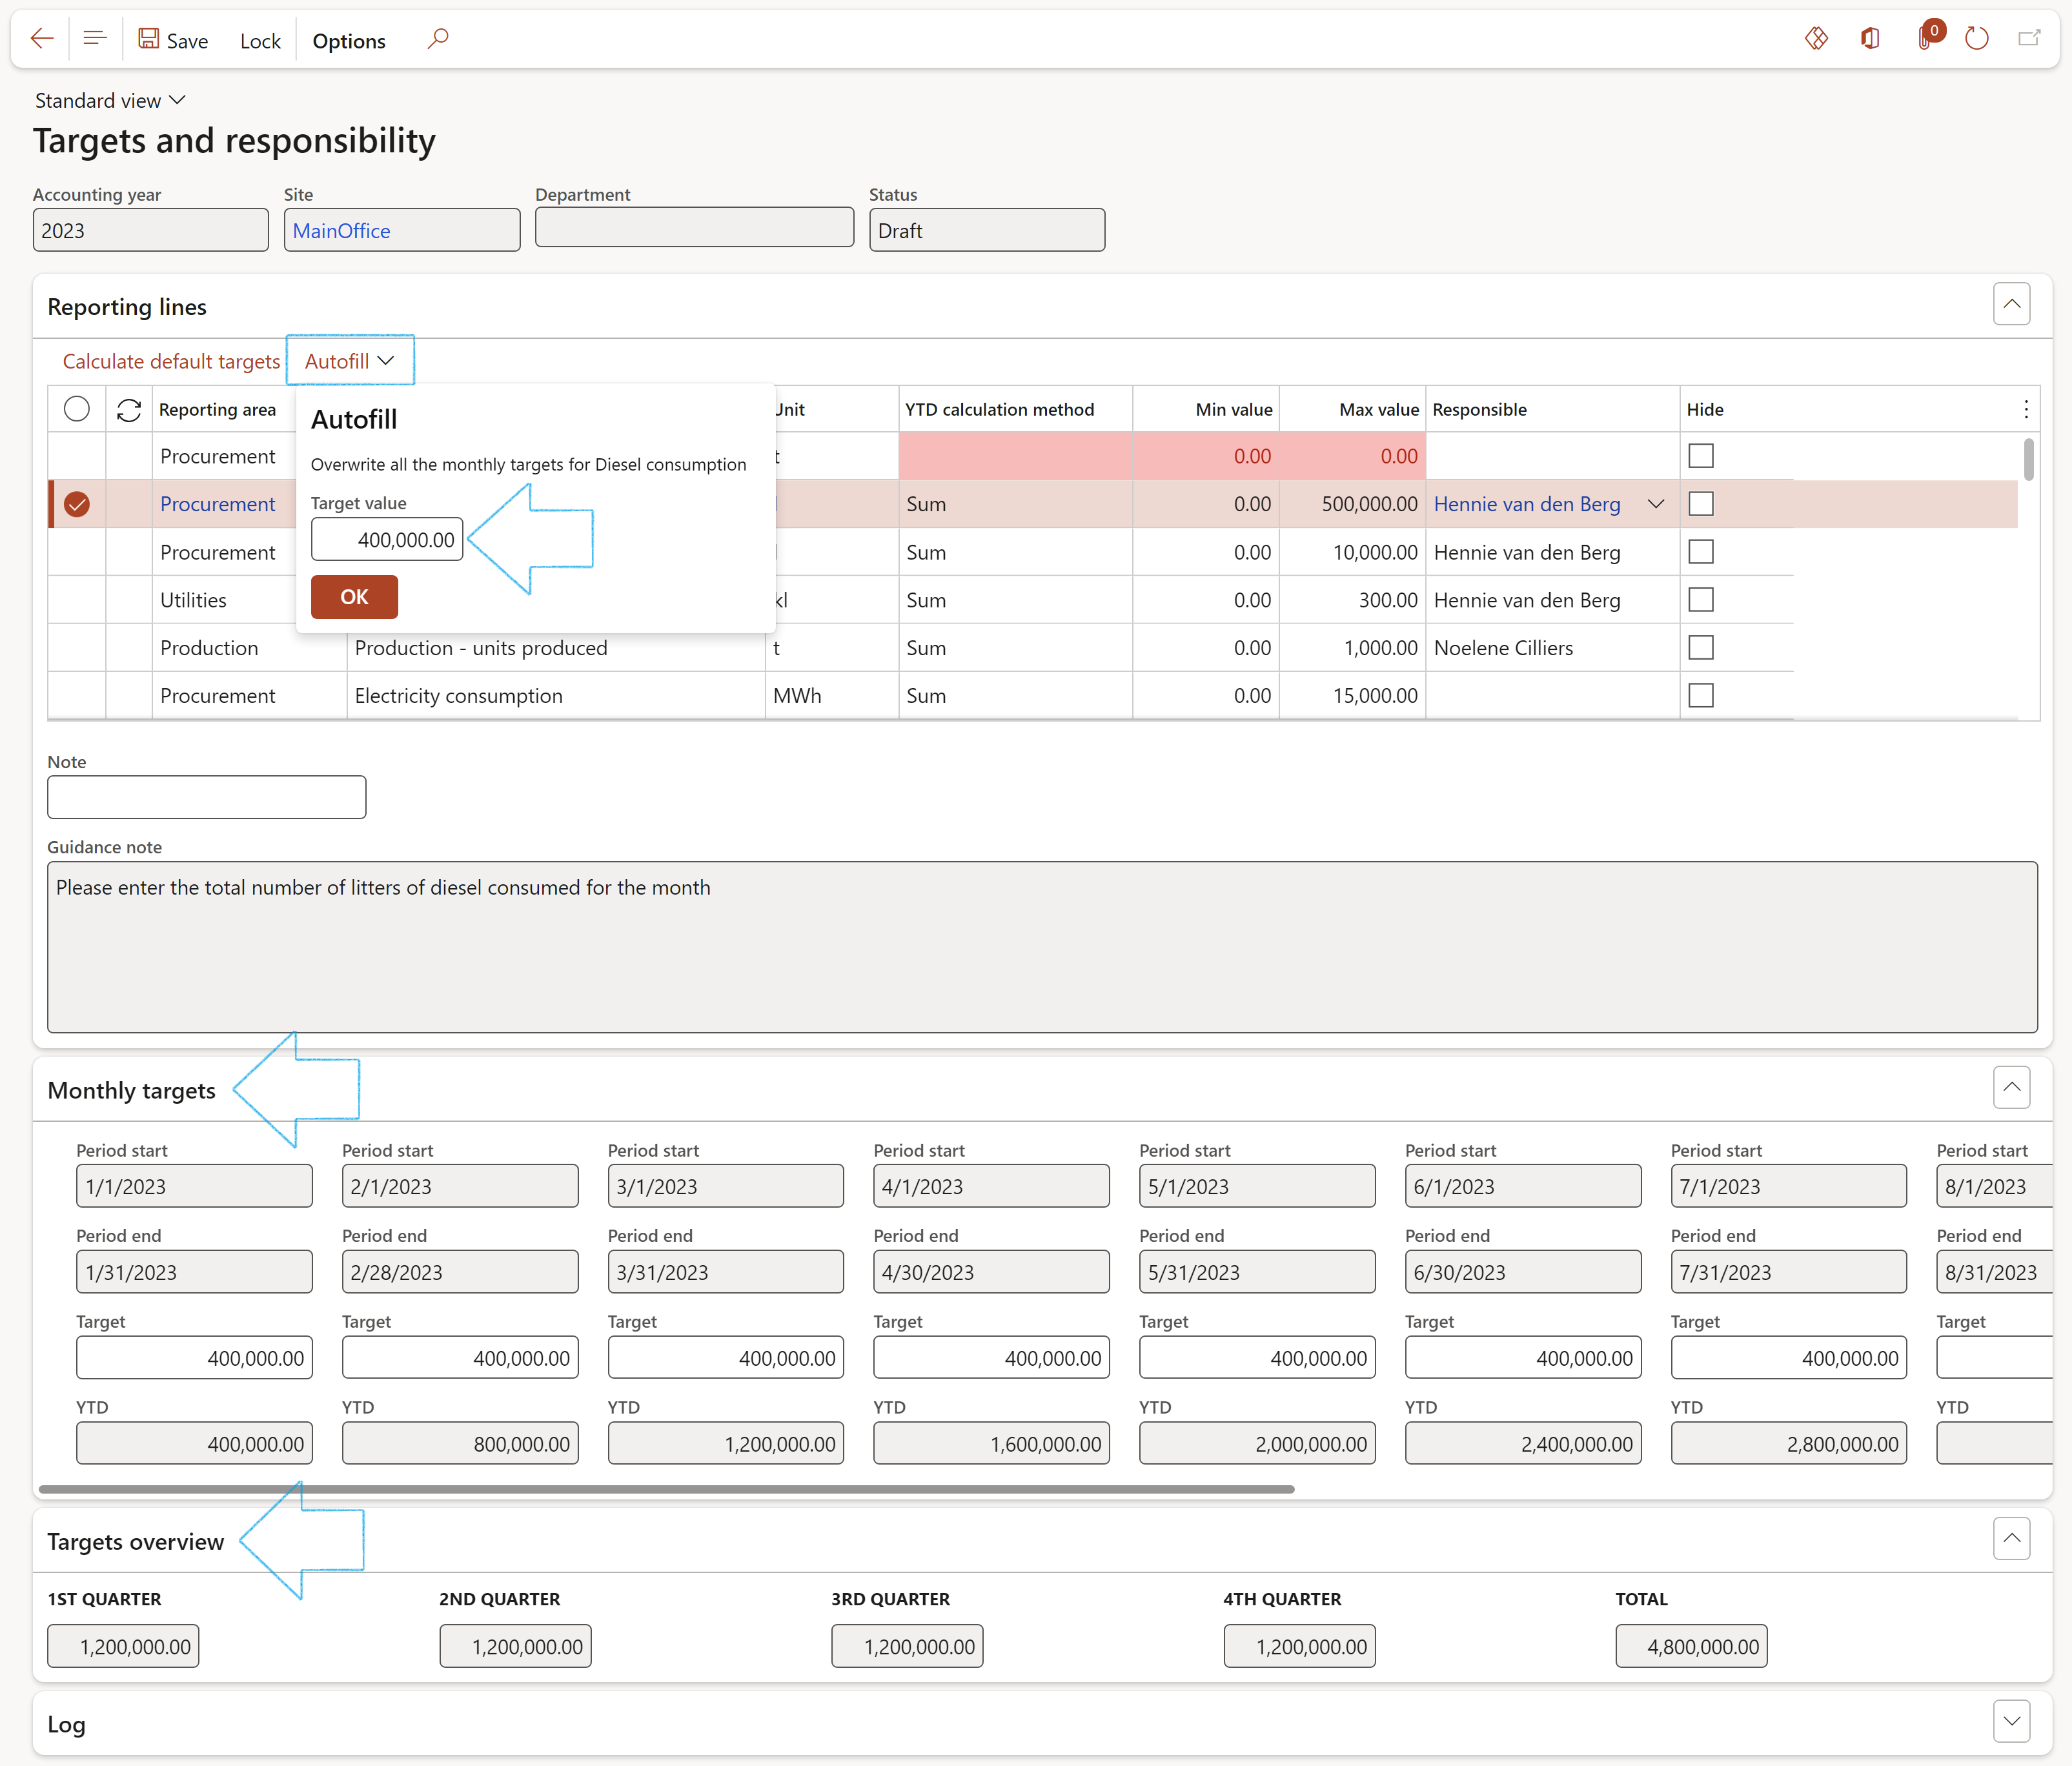
The quarterly targets are displayed under theTargets overview Fast tab
The status of the record can be changed to locked and reopened by clicking on the Lock/Reopen button in the Action pane. A log of these actions is displayed under the Log Fast tab.
¶ Daily use
¶ Step 9: Create reporting data
Go to: GRC > Operational & sustainability reporting > Reporting data
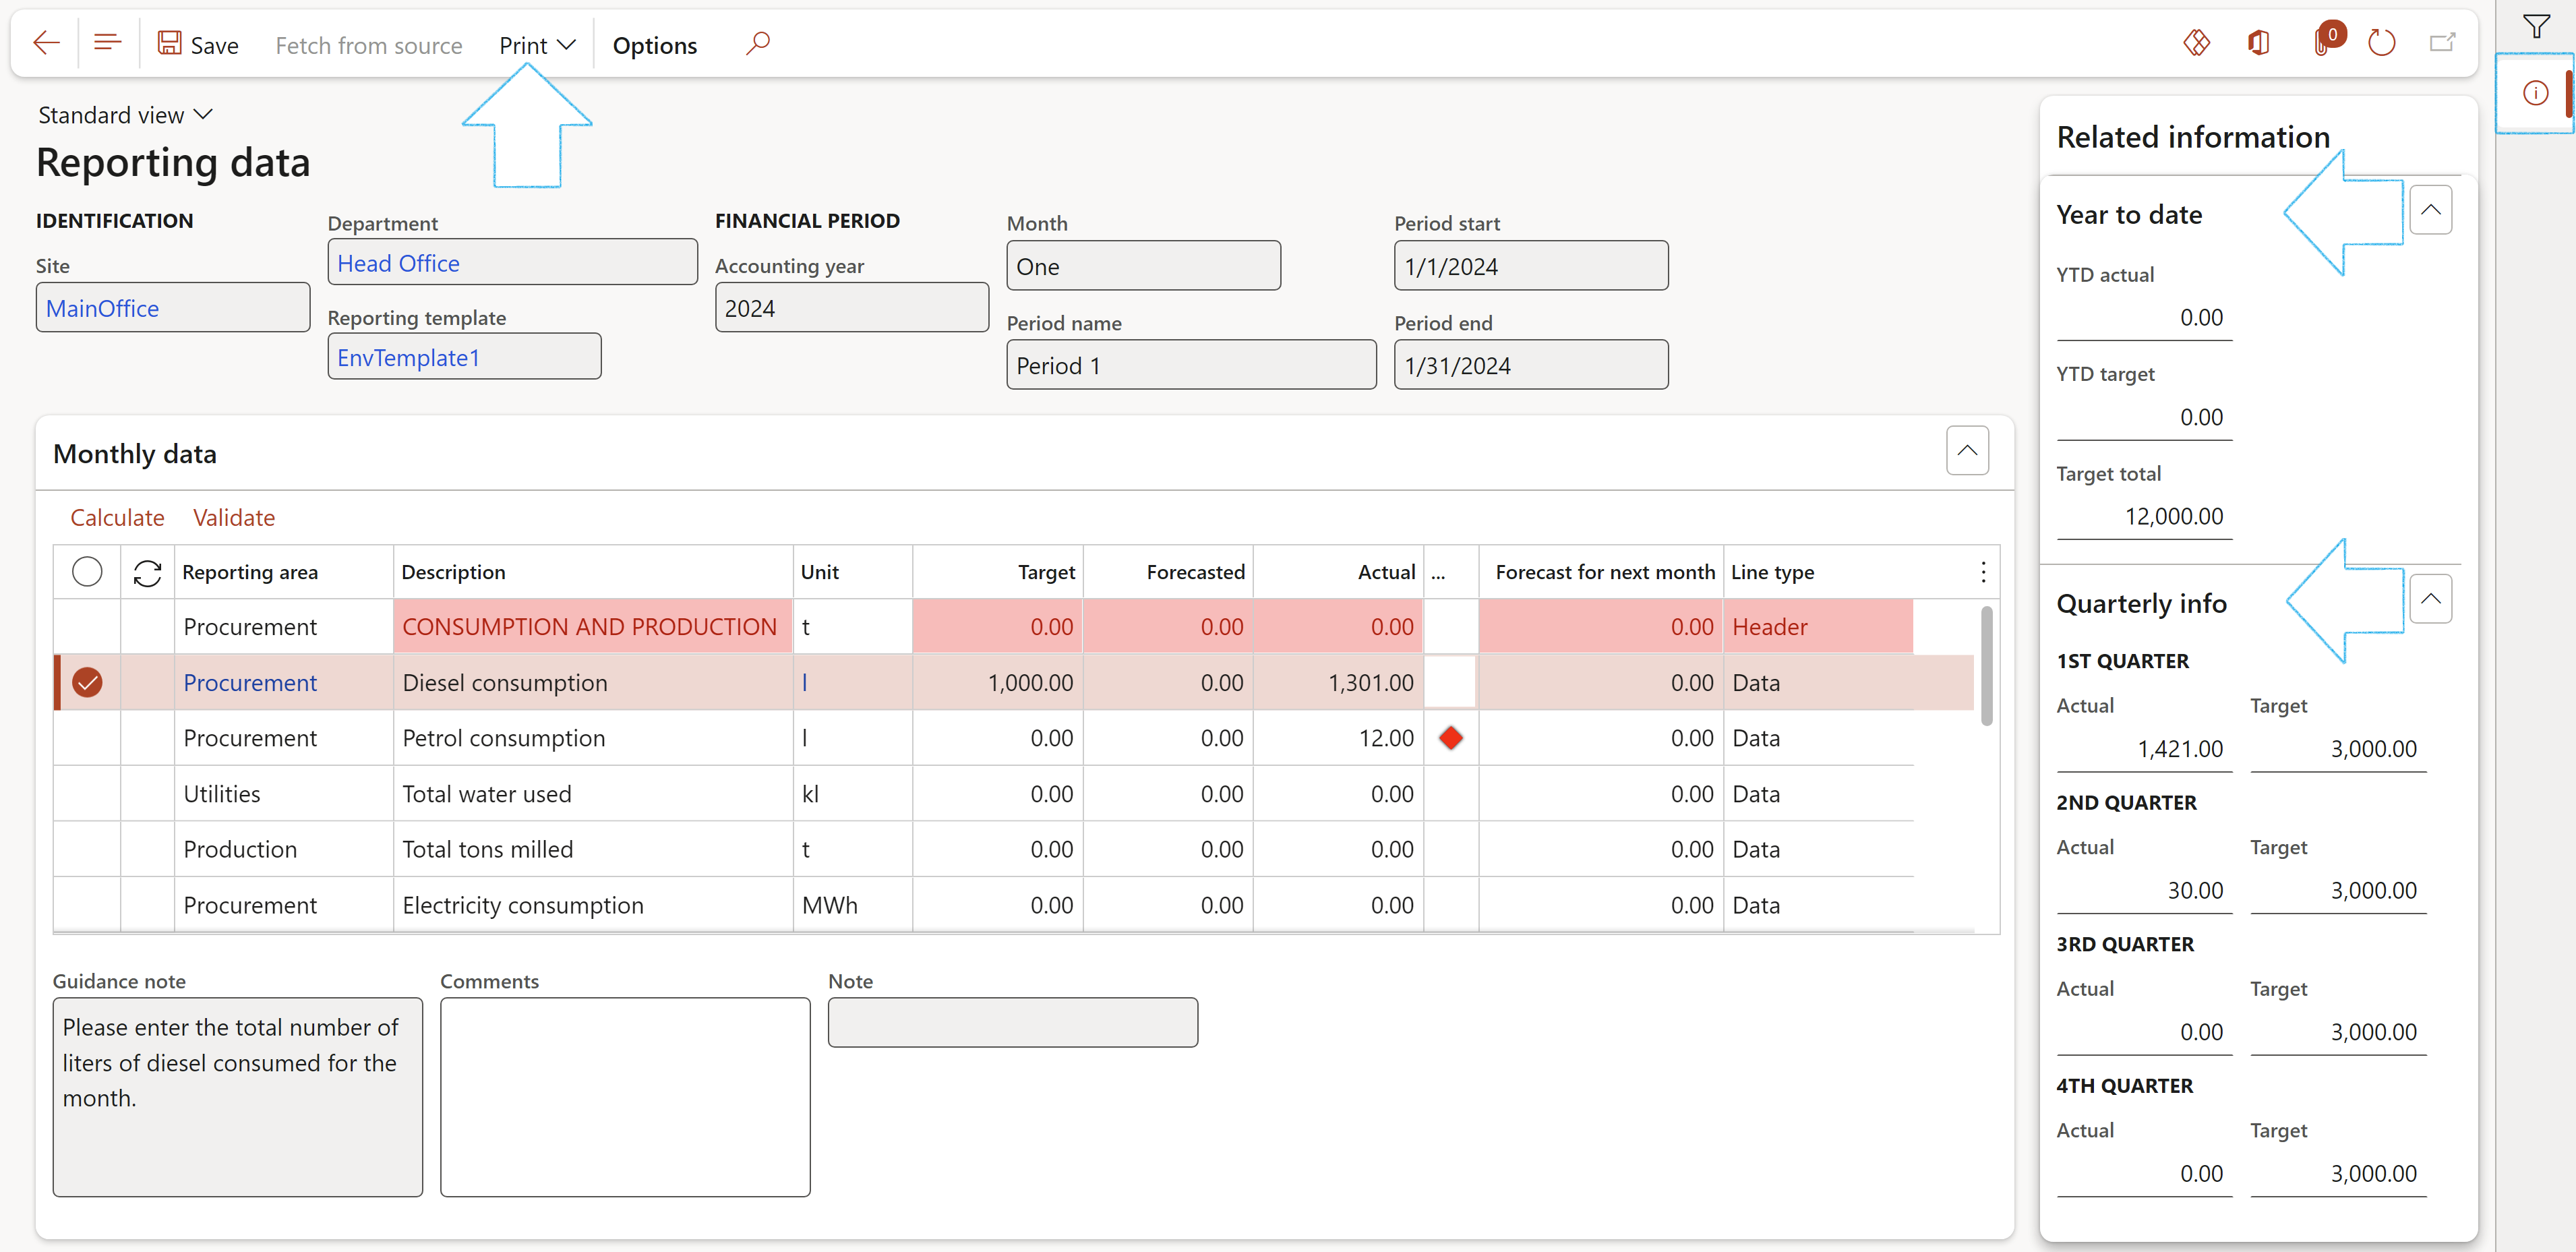
The user can has the option to print the Monthly report and the Year to date report by clicking on the Print button in the Action pane, and selecting the relevent option
The user can choose to view only records that he/she is responsible for by going to: GRC > Operational & sustainability reporting > My reporting data
¶ Using the Fetch from source button
Where the line type = source on the Reporting template, data can be fetched from the source with the click of a button
¶ Reporting
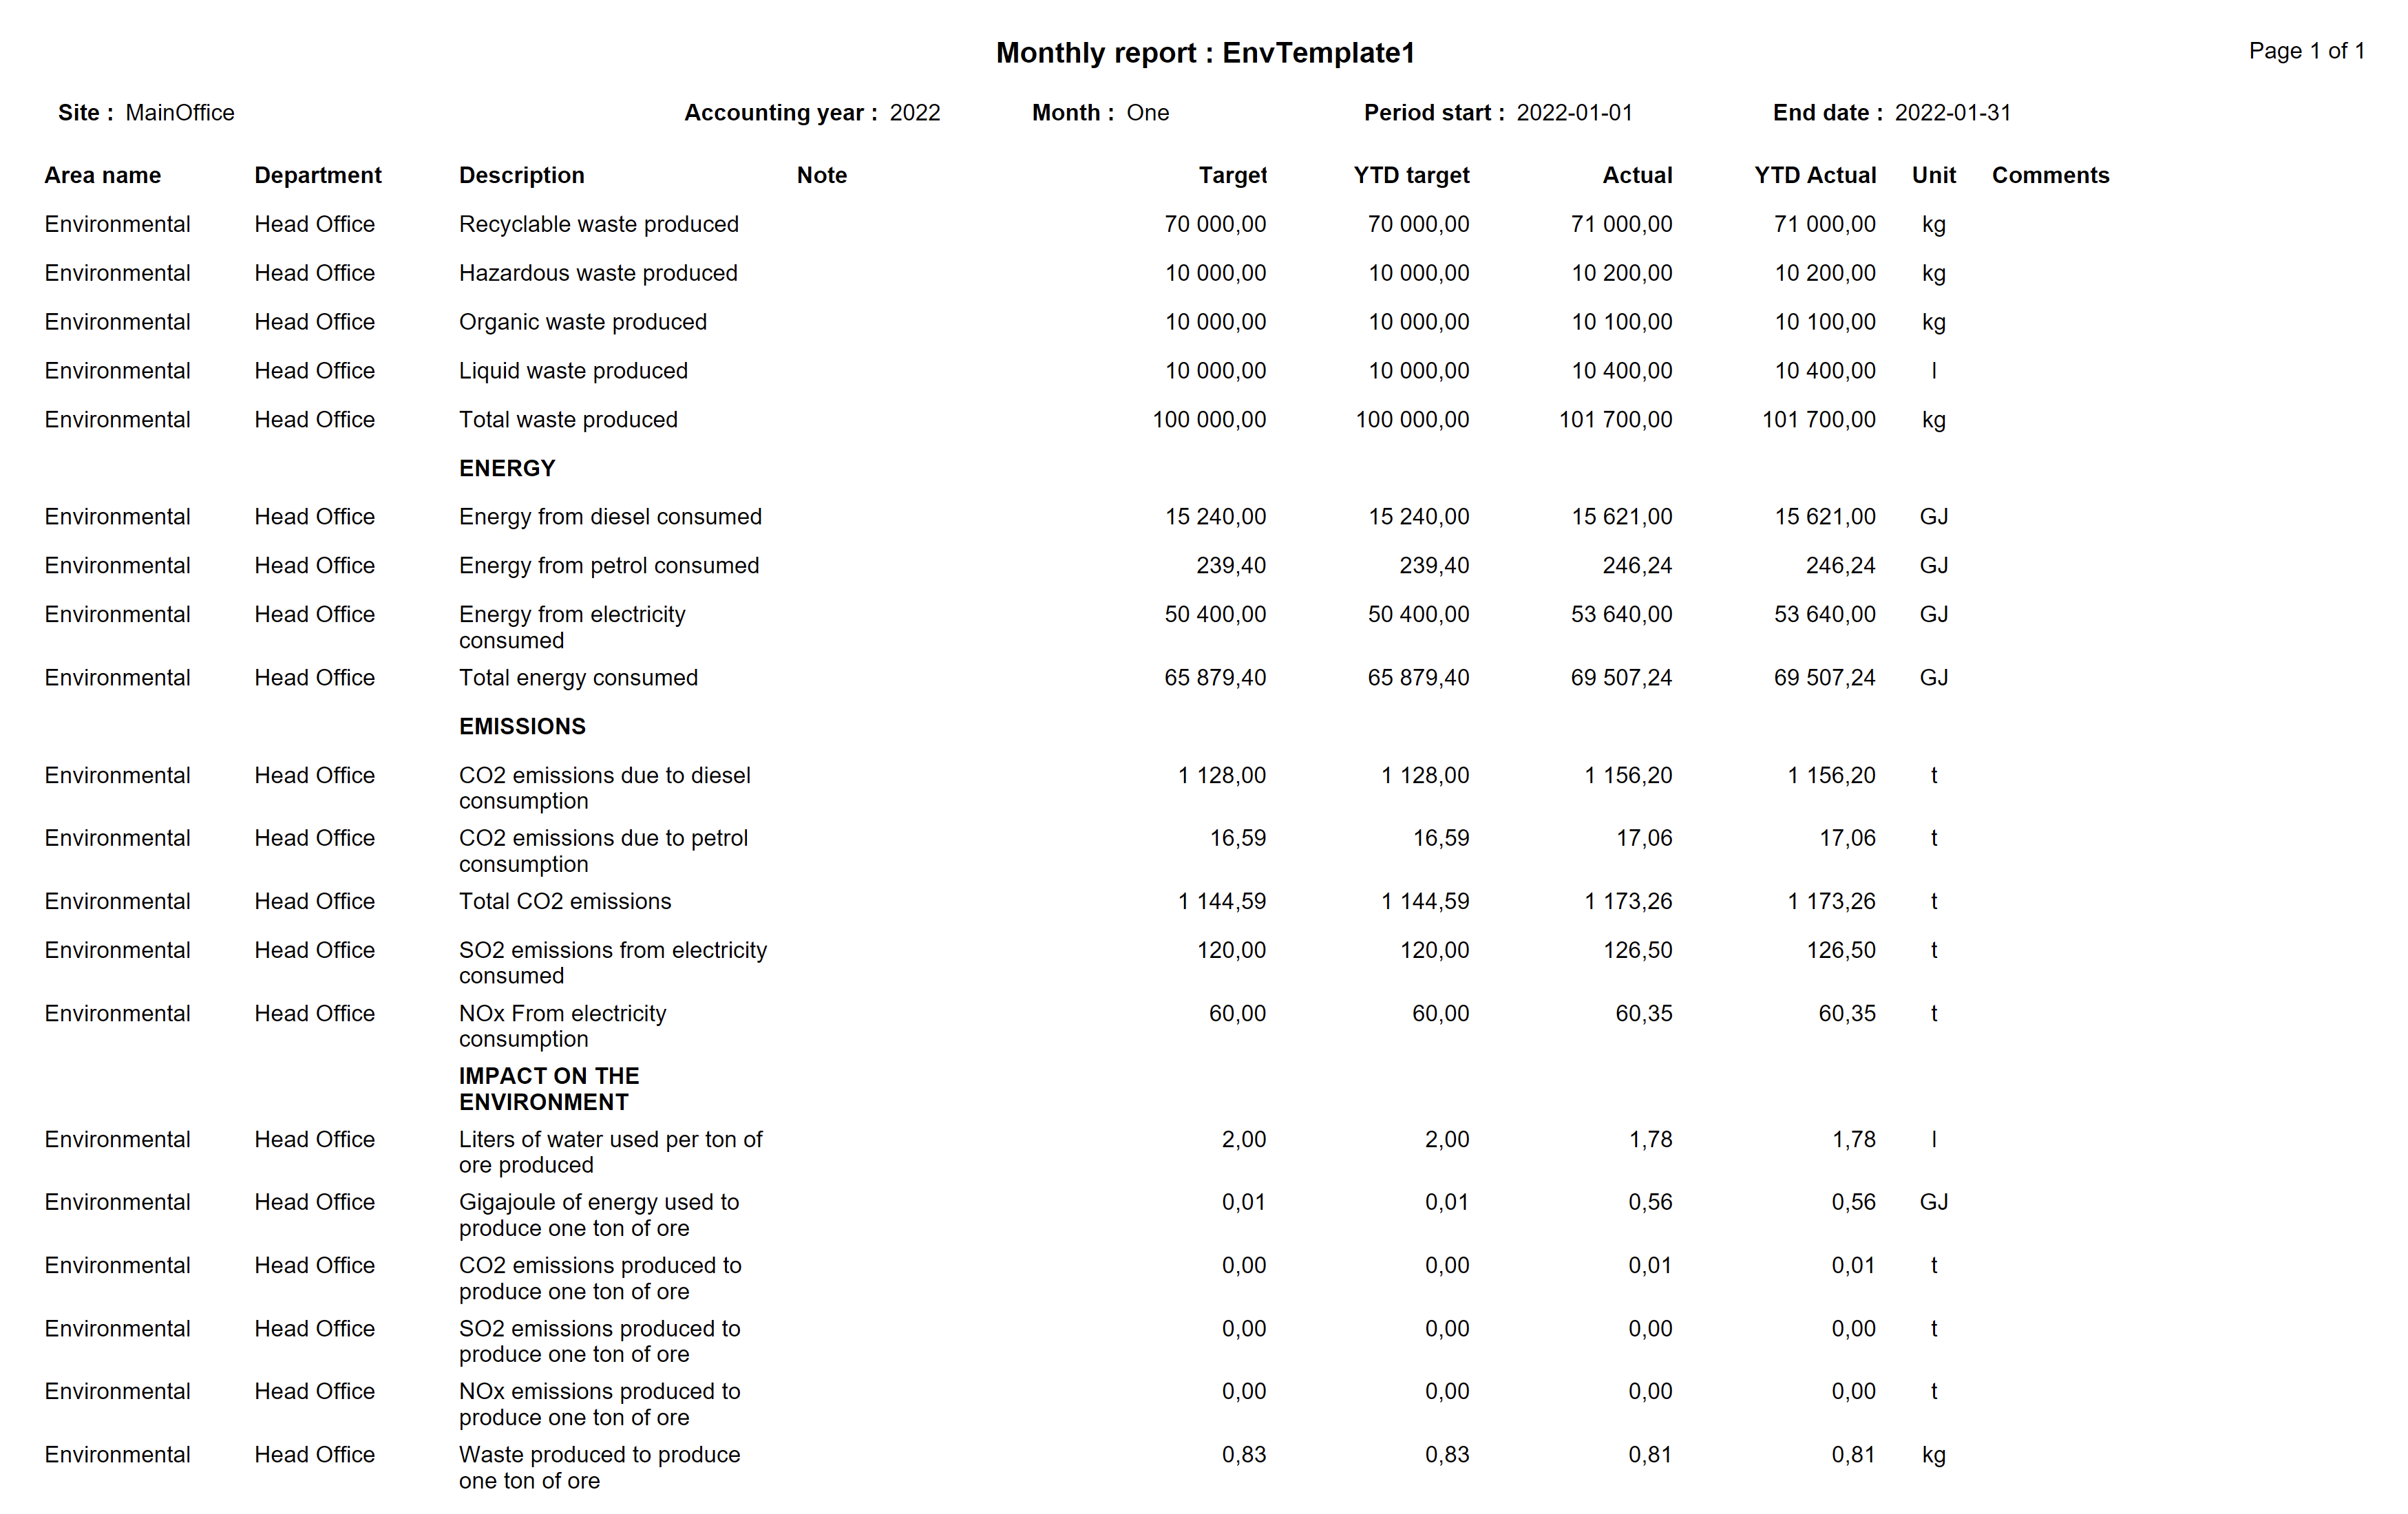
¶ Step 10: Monthly report
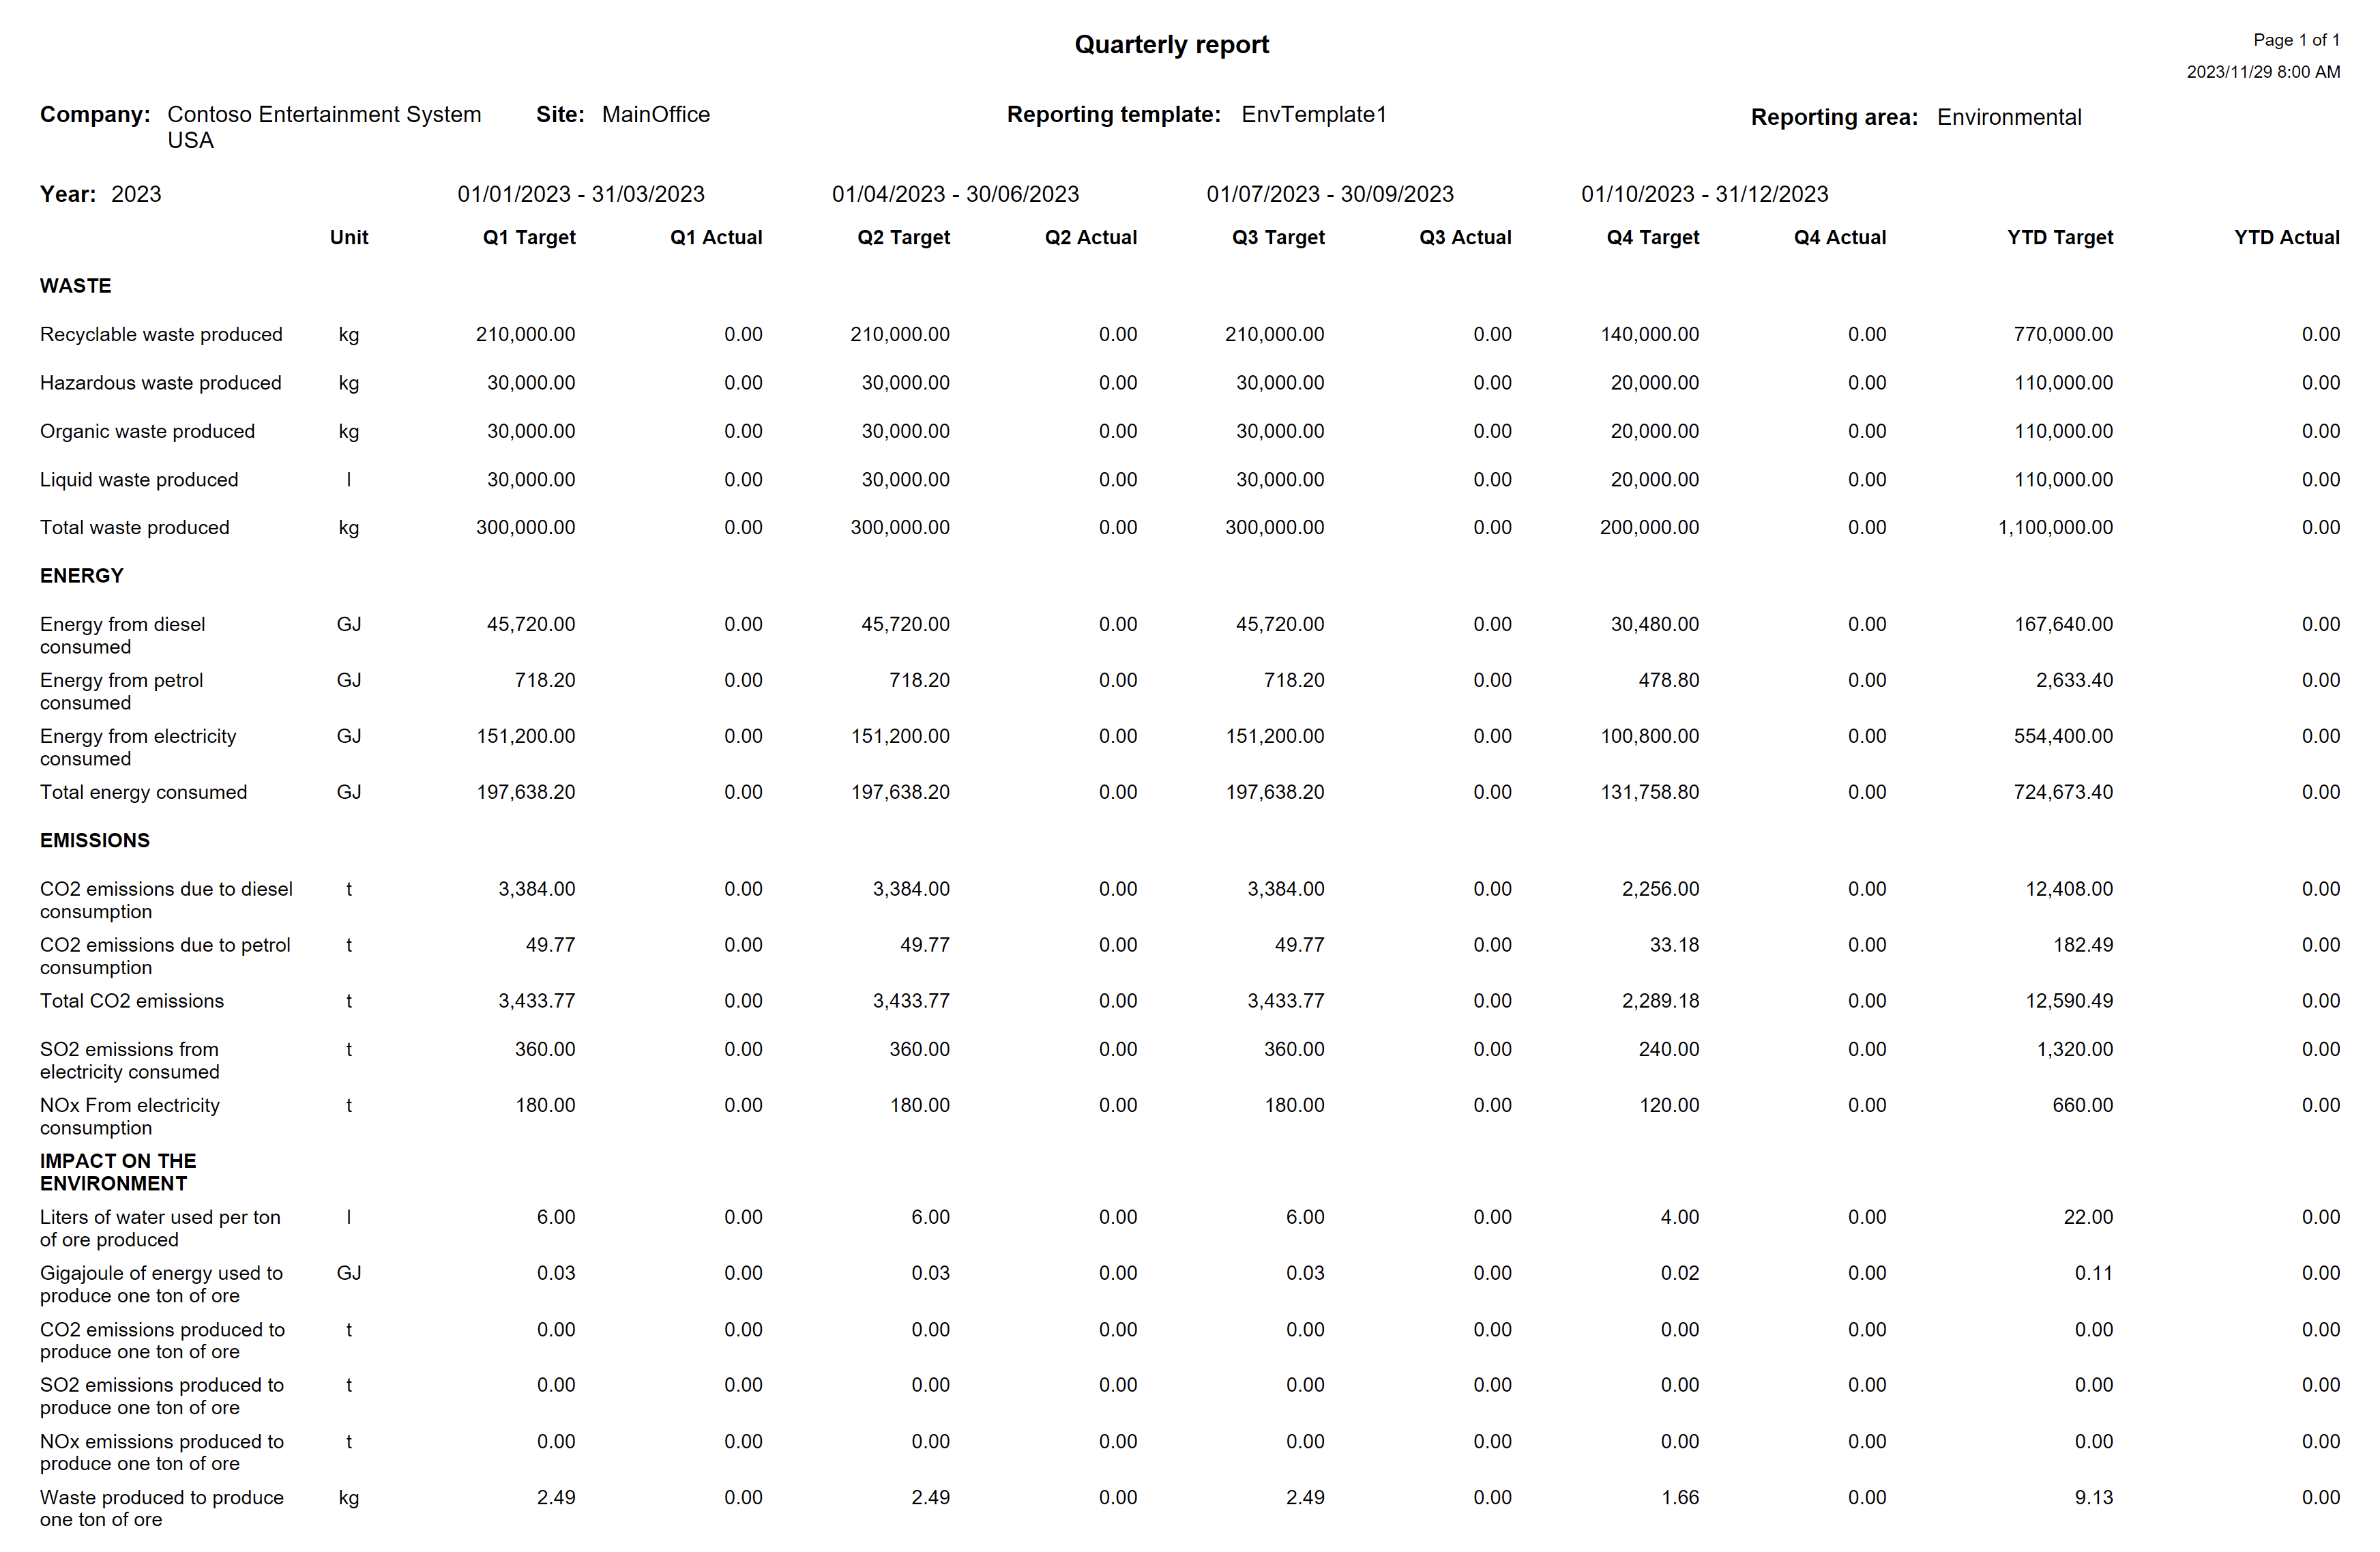
The Monthly report shows the monthly data for all the records that are not hidden for this site
Go to: GRC > Operational & sustainability reporting > Reports and inquiries > Monthly report
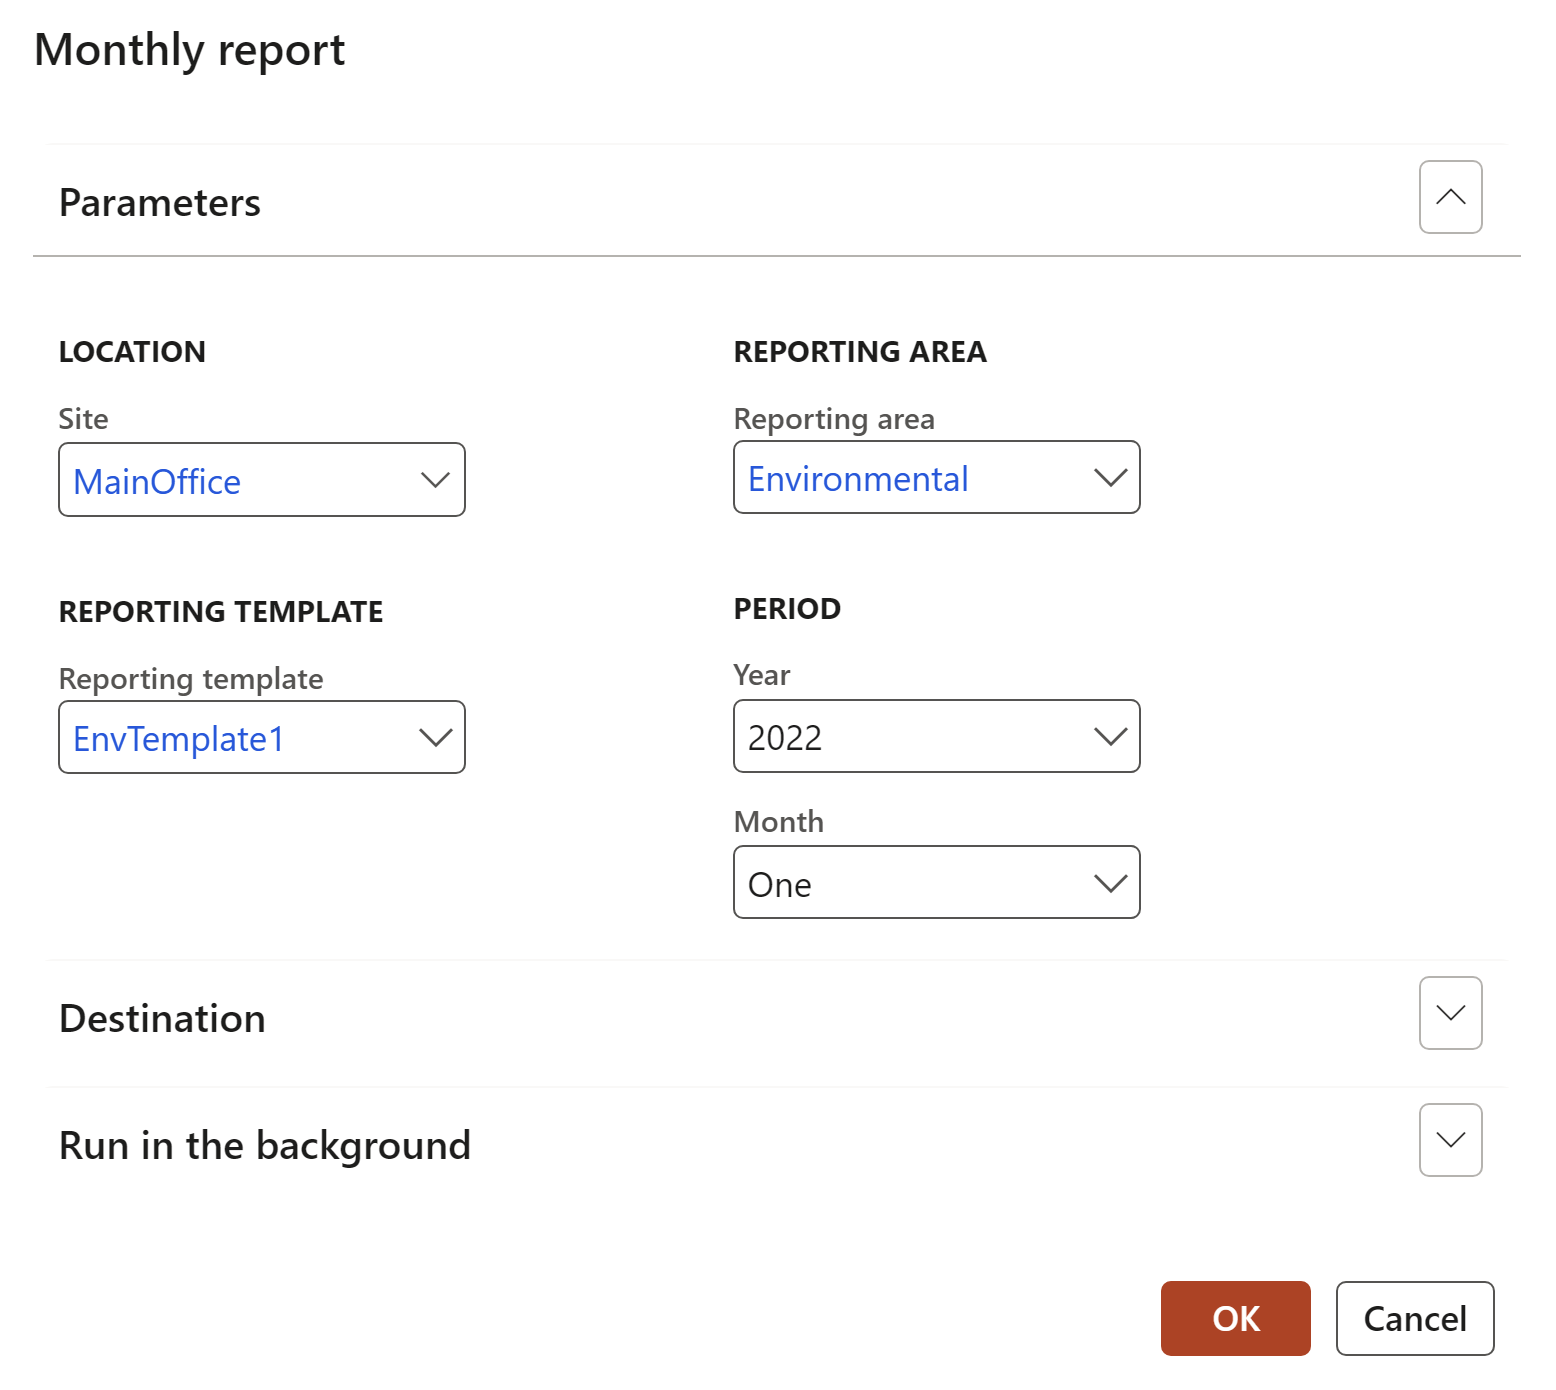
The order of the records in the report is the same as it is setup on the template.
Records that are marked as header records are printed in bold.
¶ Step 11: Target vs actual graph
This graph will display the Actual vs target values of a specific row in a graphical form as well as in a table form, for all twelve months of the fiscal year.
Go to: GRC > Operational & sustainability reporting > Reports and inquiries > Reporting area row target vs actual graph
¶ Step 12: Year to date report
Go to: GRC > Operational & sustainability reporting > Reports and inquiries > Year to date report
¶ Step 13: Quarterly report
Go to: GRC > Operational & sustainability reporting > Reports and inquiries > Quarterly report
¶ Step 14: Operational & sustainability reporting workspace
¶ Step 14.1: Workspace setup
The Workspace setup form gives the user the ability to specify how the Operational & sustainability reporting workspace should be displayed
Go to: GRC > Operational & sustainability reporting > Setup for operational & sustainability reporting > Workspace setup
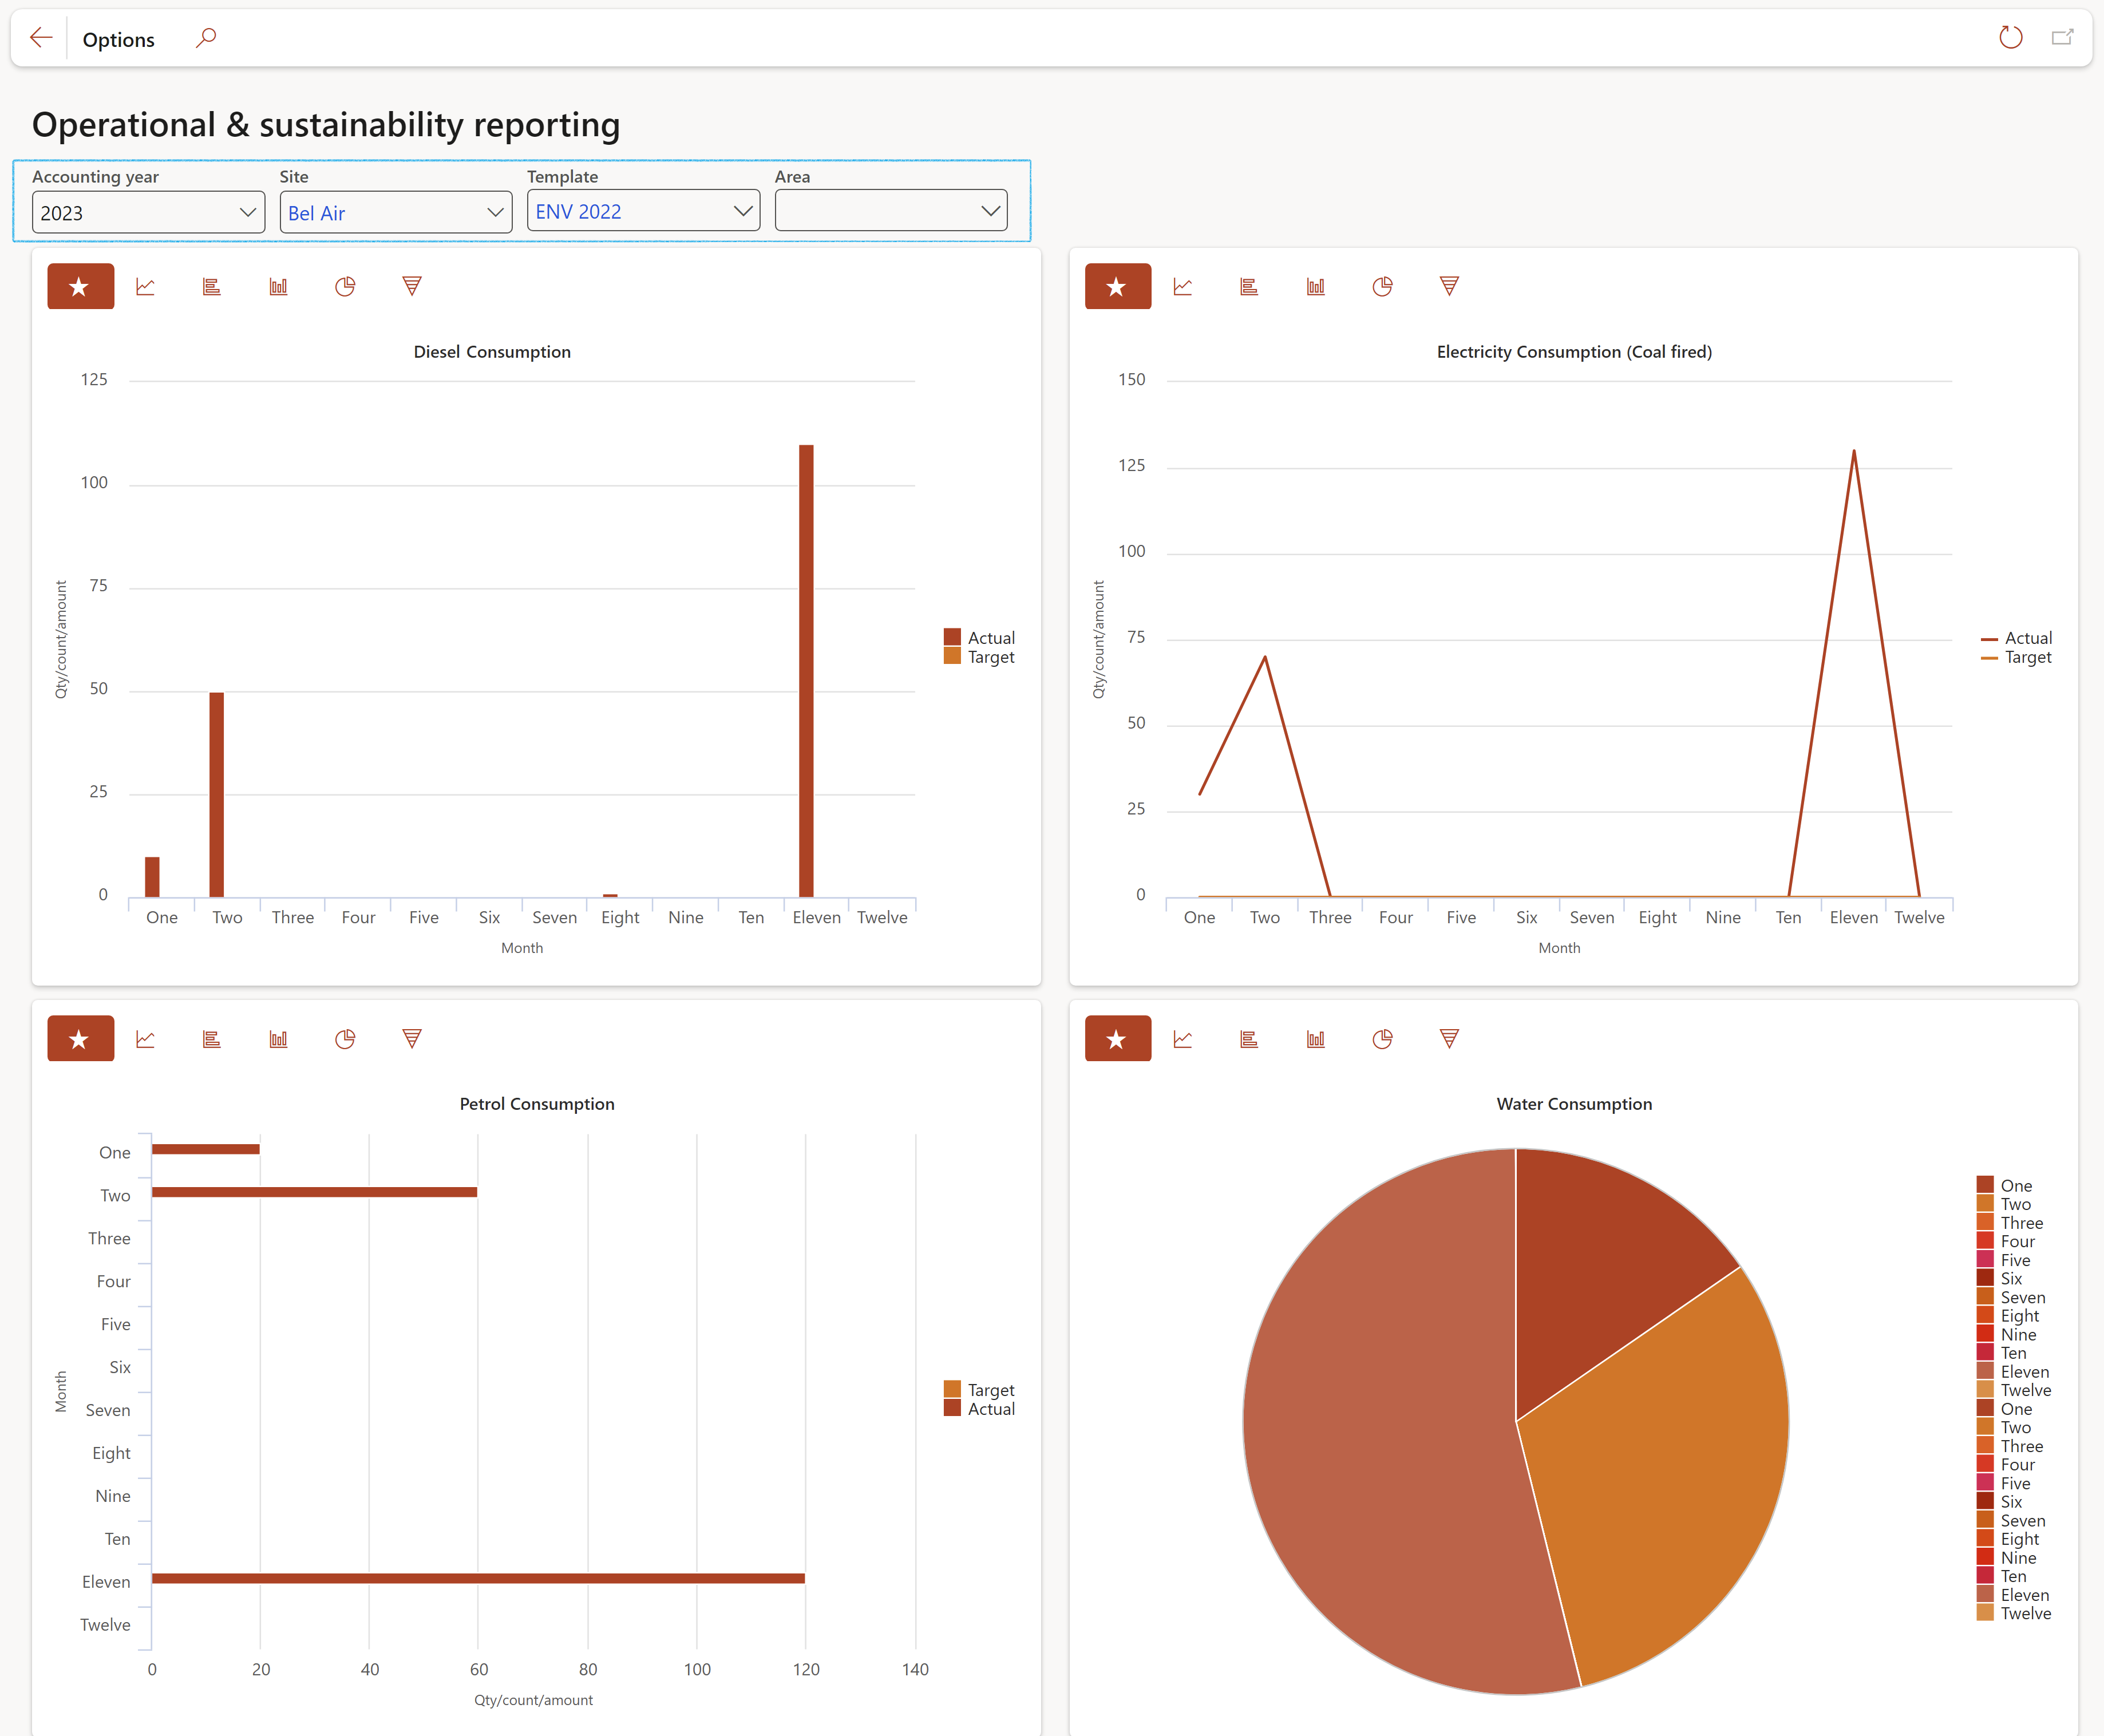
¶ Step 14.2: Operational & sustainability reporting workspace
Go to: GRC > Workspaces & Operational & sustainability reporting
¶ Data entities
Data entities allow outside systems to read and write data (for importing and exporting data) in Microsoft Dynamics 365 for Finance and Operations. For example, you read the product inventory levels in D365, and send these values to your website.
¶ Step 15: List of DE used in sustainability
Global reporting data: 'Global reporting' Target entity: 'OHSGlobalReportingInitiativeTableEntity
Reporting area data: 'Reporting area' Target entity: 'OHSReportingAreaEntity'
Replacement list data:
Reporting template header data: ‘Reporting template' Target entity: ‘OHSReportingTemplateEntity’ (Please note: Only map ‘TEMPLATEID’ and ‘DESCRIPTION’ when importing data.
Reporting template lines data: ‘Reporting template lines' Target entity: ‘OHSReportingTemplateLinesEntity’
Reporting template line calculation data: ‘Reporting template line calculation' Target entity: ‘OHSReportingTemplateLineCalcEntity’
User group data:
GRC and OHS parameters data: ‘GRC and OHS parameters' Target entity: ‘OHSParametersEntity’
Data repository data:
Data repository line data. For example, the monthly targets and responsible users can be updated or exported. Data repository lines Target entity: ‘OHSReportingRepositoryLinesEntity’
Data repository line data. For example, the monthly actual values can be updated or exported. Data repository lines Target entity: ‘OHSReportingRepositoryLinesEntity’
Workspace setup data: Workspace setup Target entity: ‘OHSReportingWorkspaceSetupEntity’